Figures & data
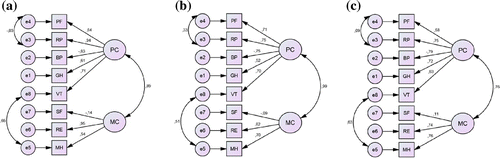
Figure 1. Eight dimensions and two components of the HRQoL (Ware et al., Citation1994).
Notes: PF = physical functioning, RP = role physical, BP = bodily pain, GH = general health, VT = vitality, SF = social functioning, RE = role emotional, MH = mental health, PC = physical component, MC = mental component. e1–e8 = corresponding error terms, the basis model assumes no correlation between the error terms.
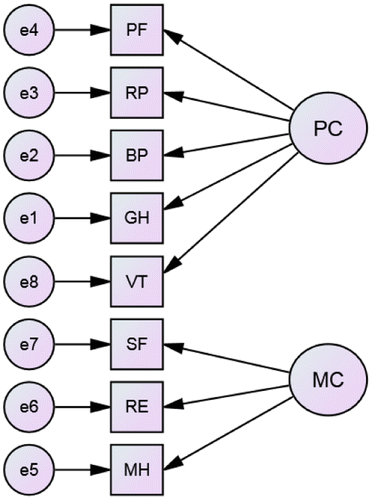
Table 1. Overview of recruitment process for each group. Absolute numbers of participants
Table 2. Overview of interview venues for each group. Absolute numbers of participants
Table 3. Background demographics of study sample
Table 4. Socio-economic data of study sample
Table 5. Cronbach’s α for the eight Sf-36 dimensions, Turkish, Polish and German group
Table 6. CMIN/df, CFI and RMSEA for Turkish, Polish, and German samples, before modification
Figure 2. (a) Model for Turkish group, after modification. CMIN/df: 5.307, CFI: 0.868 , RMSEA: 0.209. (b) Model for Polish group, after modification. CMIN/df: 1.501 , CFI: 0.976 , RMSEA: 0.070 and (c) Model for German group, after modification. CMIN/df: 3.790, CFI: 0.851, RMSEA: 0.167.
Notes: e1–e8 = errors, PF = physical functioning, RP = role physical, BP = bodily pain, GH = general health, VT = vitality, SF = social functioning, RE = role emotional, MH = mental health, PC = physical component, MC = mental component, CMIN/df = Chi-square/degrees of freedom, CFI = comparative fit index, RMSEA = root mean square error of approximation. General rule for acceptable fit: CMIN/df: < 3.0, CFI: ≥ 0.95, RMSEA: < 0.05–0.08. Acceptable fits are bold and italic.