Figures & data
Table 1. Module components and the relevant skills and techniques used for web transformation
Figure 1. Flow chart depicting the sequence of the delivery of the randomized controlled trial.
Exhibit 1. Snap shot of the steps 3–5 of the first session of the experimental group.
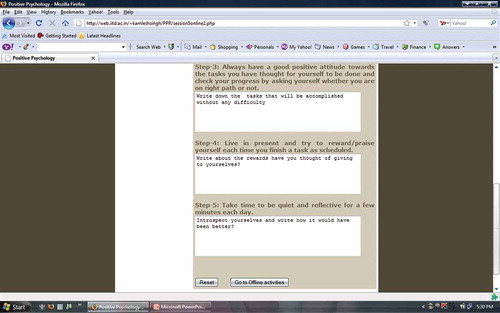
Table 2. Means, Standard Deviations, Cronbach Alpha’s and t-values of the measures used in pre- (Time-1) and post- (Time-2) intervention module for experimental group (n = 75)
Table 3. Paired sample t-test between pairs of pre- and post-standardized measures and the general and specific item measure before and after the intervention in the experimental group: (n = 75)
Table 4. Means, standard deviations, t-values and effect sizes of the measures used at Time-1 and Time-2 of intervention module for placebo group (n = 56)
Table 5. Means, standard deviations, Cronbach’s alpha, t-values and effect sizes of the measures used at Time-1 and Time-2 of intervention module for control group (n = 46)
Figure 2. Stacked line graphs showing intervention effect of components across groups.
Notes: Top left: Intervention effect of self-management skill across groups; top right—intervention effect of emotional intelligence skills across the groups; bottom left—intervention effect of time-management skills across groups; bottom right—intervention effect of Stress management skills across groups before and after the intervention.