Figures & data
Table 1. Sections and modules of MAP-NET
Figure 1. The network map provides a visual output of the size and composition of the PSN including the NMs’ level of closeness to the FP. The list of NMs generated in Module 3 is shown on the left. The sub-questions on the right are used later in the assessment.
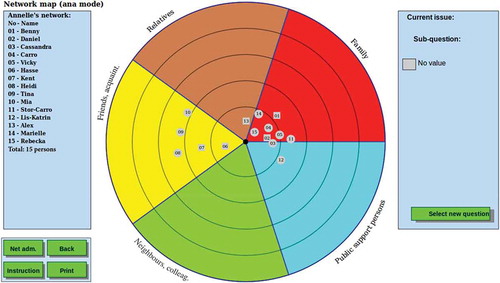
Figure 2. Family and relationship trees for the FP (left) and the partner (right). The list of NMs generated in Module 3 is shown on the left of the picture.
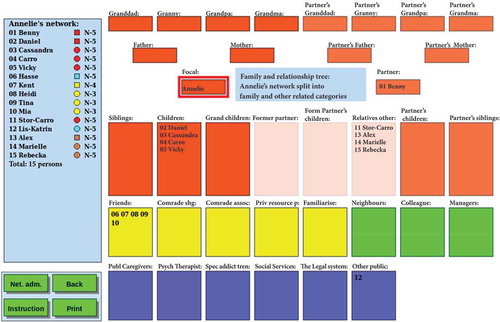
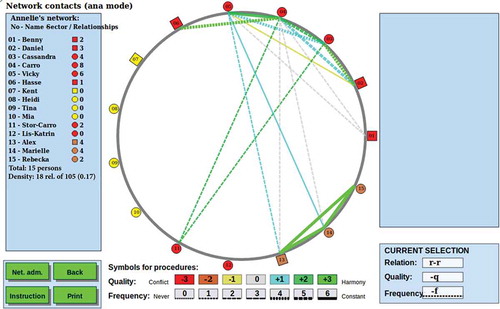
Figure 3. The contact map provides a visual output of the density of the PSN and of the interrelations between the NMs. The list of NMs is shown on the left.