Figures & data
Figure 1. Hypothesized mediation model of the relations among SES, sense of control and attributions regarding the cause of the problem and responsibility for the solution.
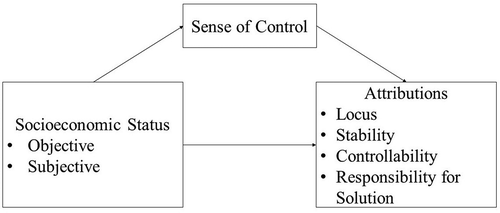
Table 1. Means (M), Standard Deviations (SD), Reliabilities (α) and Correlations among Study Variables
Table 2. Summary of Hierarchical Regression Analysis for Variables Predicting Sense of Control
Table 3. Summary of Hierarchical Regression Analyses for Variables Predicting Attributions
Table 4. Summary of Hierarchical Regression Analysis for Variables Predicting Attribution of Responsibility for Solution
Figure 2. Objective SES predict attribution for the locus of the problem cause through sense of control. Coefficients are shown with standard error in parentheses. Percentile bootstrapped 95% confidence intervals for the direct effect are indicated in brackets. Coefficients are significant if p < .05.
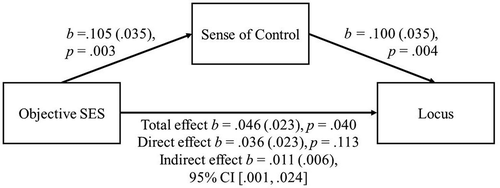
Figure 3. Objective SES predict attribution for the perceived stability of the problem cause through sense of control. Coefficients are shown with standard error in parentheses. Percentile bootstrapped 95% confidence intervals for the direct effect are indicated in brackets. Coefficients are significant if p < .05.
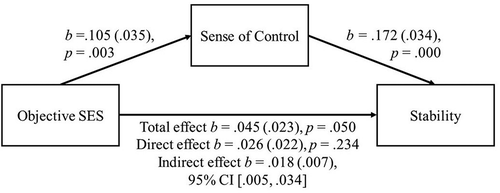
Figure 4. Objective SES predict attribution for the perceived controllability of the problem cause through sense of control. Coefficients are shown with standard error in parentheses. Percentile bootstrapped 95% confidence intervals for the direct effect are indicated in brackets. Coefficients are significant if p < .05.
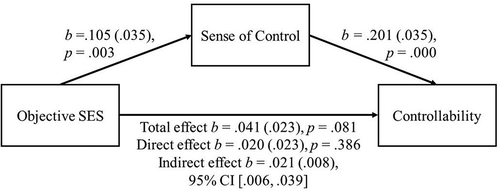
Figure 5. Objective SES predict attribution for the perceived responsibility for the solution through sense of control. Coefficients are shown with standard error in parentheses. Percentile bootstrapped 95% confidence intervals for the direct effect are indicated in brackets. Coefficients are significant if p < .05.
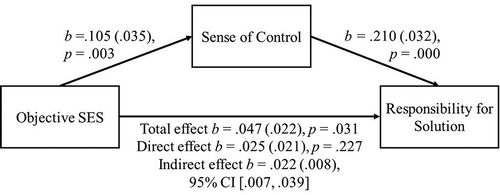
Figure 6. Subjective SES predict attribution for the locus of the problem cause through sense of control. Coefficients are shown with standard error in parentheses. Percentile bootstrapped 95% confidence intervals for the direct effect are indicated in brackets. Coefficients are significant if p < .05.
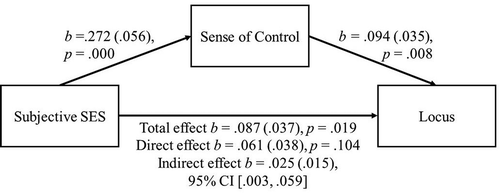
Figure 7. Subjective SES predict attribution for the perceived stability of the problem cause through sense of control. Coefficients are shown with standard error in parentheses. Percentile bootstrapped 95% confidence intervals for the direct effect are indicated in brackets. Coefficients are significant if p < .05.
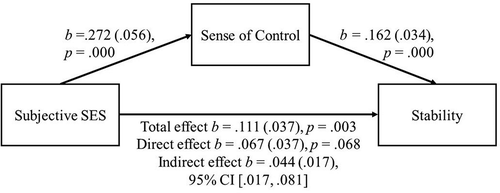
Figure 8. Subjective SES predict attribution for the perceived controllability of the problem cause through sense of control. Coefficients are shown with standard error in parentheses. Percentile bootstrapped 95% confidence intervals for the direct effect are indicated in brackets. Coefficients are significant if p < .05.
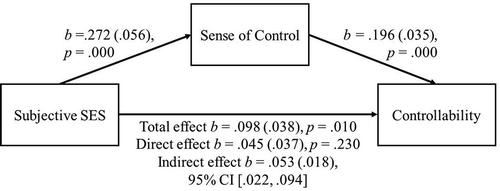
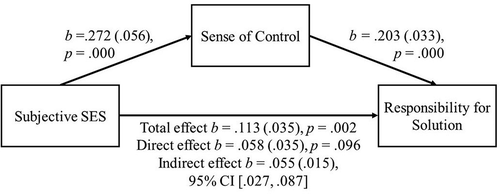
Figure 9. Subjective SES predict attribution for the perceived responsibility for the solution through sense of control. Coefficients are shown with standard error in parentheses. Percentile bootstrapped 95% confidence intervals for the direct effect are indicated in brackets. Coefficients are significant if p < .05
