
Figures & data
Figure 1. The implemented cross-over design with the procedure for the two respective groups (Group 1 in red arrows, Group 2 in blue arrows).
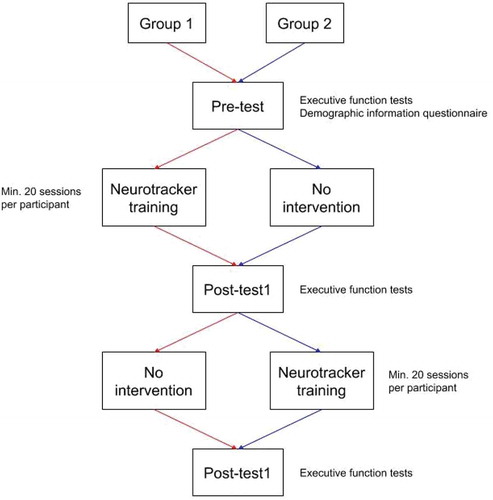
Table 1. Descriptive statistics assessing the NT variables n = 60
Table 2. Mean, standard deviation and p-values for Group 1 at pre-test, post-test 1 and post-test 2 (n = 31)
Table 3. Mean, standard deviation and p values for Group 2 at pre-test, post-test 1 and post-test 2 (n = 29)
Table 4. Summary of linear regression analysis for variables predicting the dependent variables specified as the executive test variables (n = 60)