
Figures & data
Figure 1. Trial flow for each condition and the experimental setup (bottom diagram) for Experiment 1. Ps: participants
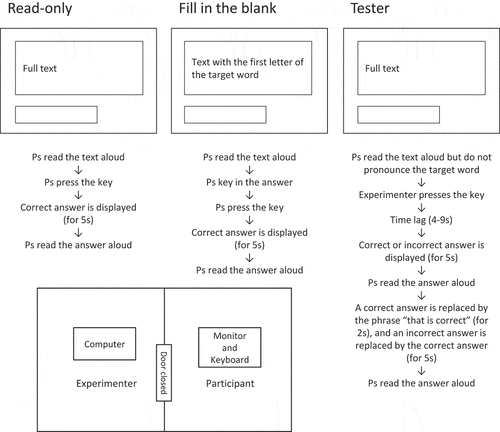
Table 1. Mean proportions of correct responses for each condition in the final test for Experiments 1 and 2. Standard errors are in parentheses
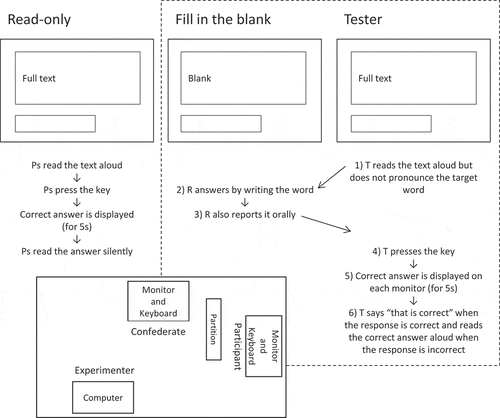
Figure 2. Trial flow for each condition and the experimental setup (the bottom diagram) for Experiment 2. Ps: participants, R: respondent, T: tester
Target words and examples of false information in Experiments 1 and 2