
Figures & data
Figure 1. PIE CHART PRESENTATION OF STUDENTS’ PERCEPTION OF ASRS
Source: Field Survey, 2019.
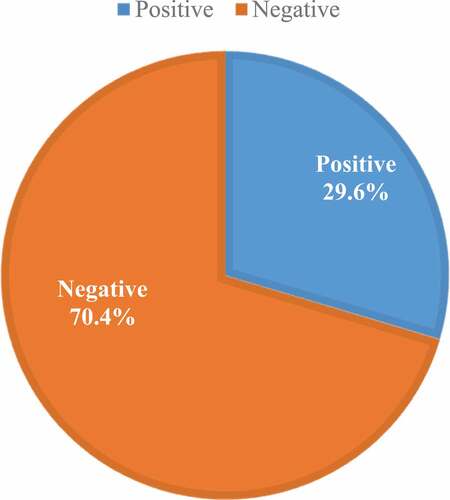
Figure 2. PIE CHART PRESENTATION OF SUMMARY OF STUDENTS’ ATTITUDE TOWARDS ASRS
Source: Field Survey by the Authors, 2020.
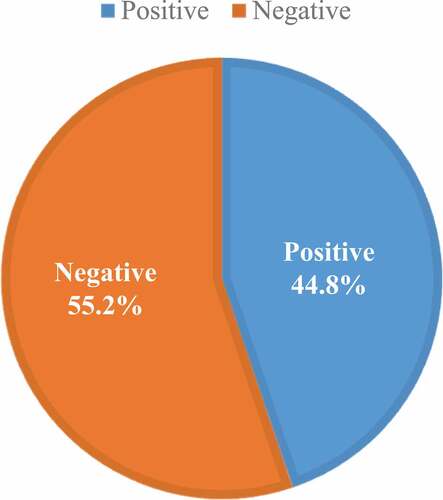
Table 1. Distribution of respondents by background characteristics (N = 203)
Table 2. Distribution of respondents’ perception of ASRs
Table 3. Distribution of respondents’ attitudes towards ASRs. Respondents were asked how comfortable they were interacting with the following people
Table 4. Further distribution of respondents’ attitude towards ASRs
Table 5. Gender distribution of the attitudes of OAU students towards ASRs
Table 6. Results from logistic regression analyses showing the effects of background characteristics of respondents on their perception and attitude towards ASRs