
Figures & data
Figure 1. Experimental layout. (A) Structure of trials in the study phase. (B) Structure of trials in the recognition test.
Table 1. The mean accuracies (M ± SD) in the face judgment task and the power-trait judgment task
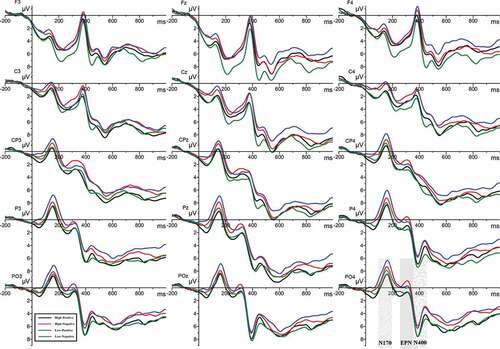
Figure 2. ERP results in the recognition test. (A) Grand average ERP waveforms at 15 exemplar electrodes, epoched from 200 ms before to 1000 ms after the onset of the face. The black line represents the High-Positive condition; the red line represents the High-Negative condition; the blue line represents the Low-Positive condition; and the green line represents the Low-Negative condition. (B) Mean amplitude in all conditions in the components of N170, EPN, and N400. Error bars represent standard errors of the means (SEMs).
Data availability statement
Data are available from the link: https://doi.org/10.6084/m9.figshare.18092948.v1