Figures & data
Figure 1. PRISMA diagram.
Table 1. Characteristics of included studies
Table 2. Interviews and measure of psychosis in included studies
Figure 2. Newcastle-Ottawa quality assessment Scale (NOS) for case–control studies (Ramsdal et al. 2018).
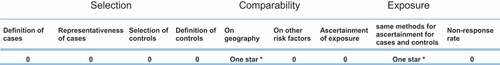
Figure 3. Appraisal tool for cross-sectional studies (AXIS) (Reissner et al. 2010).