
Figures & data
Table 1. Sociodemographic description of participants in the three odorant conditions (N = 60)
Figure 1. Virtual rooms searched prior to the virtual kitchen.
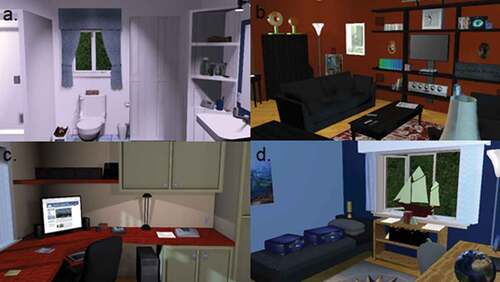
Figure 2. Virtual kitchen and immersion room.
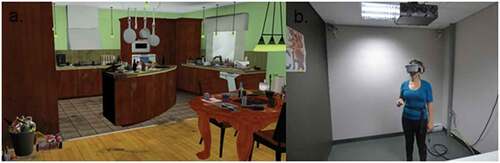
Figure 3. The 30-second in vivo exposure to the olfactory stimulus previously used in the virtual kitchen.
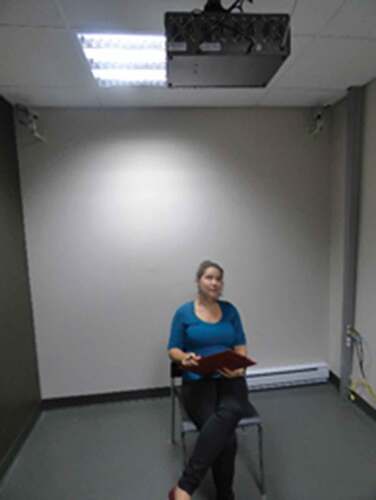
Table 2. Brief measures of presence and reality collected in virtuo
Table 3. Planned contrasts for measures of presence, reality, and realism collected in virtuo
Figure 4. Illustration of the brief measure of presence x time interaction effect, as shown by mean change from the control to the experimental condition.
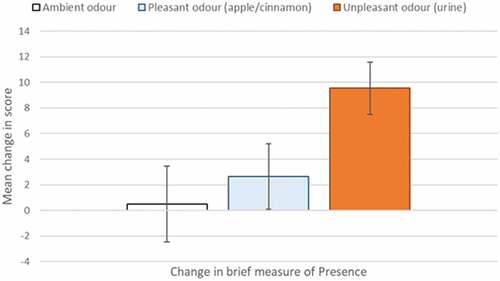
Figure 5. Sense of presence (as measured by the spatial presence subscale of the ITC-SOPI).
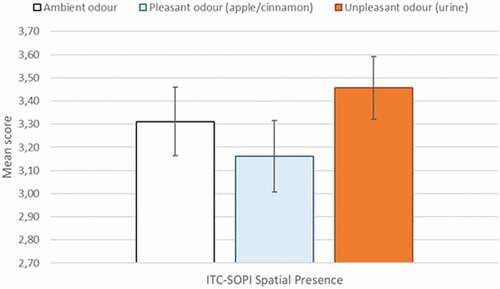
Table 4. Relationship between presence and characteristics of odors
Figure 6. Illustration of the brief measure of reality X time interaction effect, as shown by mean change from the control to the experimental condition.
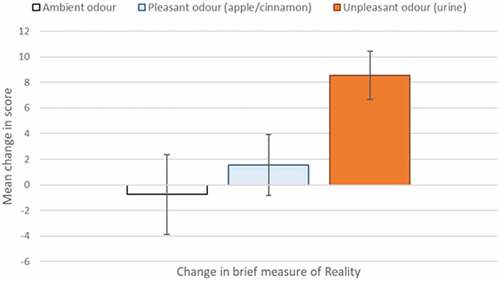
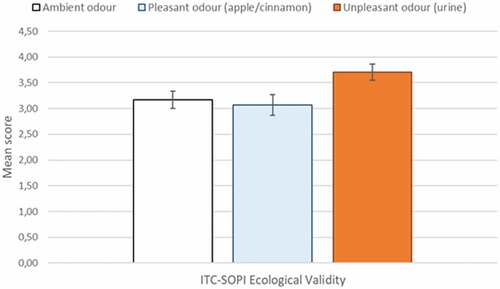
Figure 7. Sense of realism (as measured by the ecological validity subscale of the ITC-SOPI).
Supplemental Material
Download MS Word (50 KB)Data Availability Statement
The data that supports the findings of this study is available upon request addressed directly to the relevant Research Ethics Boards ([email protected] and [email protected]). The dataset is not publicly available due to privacy and ethical restrictions.