
Figures & data
Figure 1. Grasping device. this device can measure 0–400 g of grasping force.
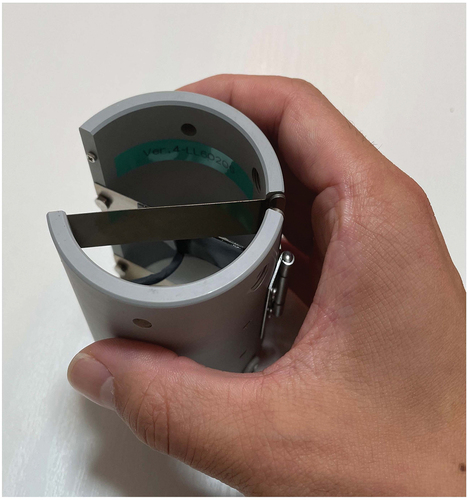
Figure 2. Target grasping force task. this experimental task consists of three different phases (0–0.4 kg, 0–0.3 kg, and 0–0.2 kg).
Figure 3. KR displayed for each practice condition. target grasping force shown as dashed lines and measured grasping force shown as solid lines. The black-filled area indicates the BW. (A) The control condition has no BW. (B) The narrow BW condition has a tolerance of ± 0.05 kg BW. (C) The wide BW condition has a tolerance of ± 0.10 kg BW. (D) The adjusted BW condition changes the tolerance of the BW based on the previous block’s performance. The narrow BW condition and the wide BW condition did not change BW, and the adjusted BW condition only changed the tolerance of the BW (block arrows indicate changes in the tolerance of the BW).
Figure 4. The trends of BW trend in practice sessions (Blocks 1–3). The narrow BW and wide BW conditions did not change bandwidth during the practice sessions, while the adjusted BW condition gradually narrowed bandwidth through the practice sessions.
Figure 5. The trends of ACE (pretest–delay retention-test). Five trials were conducted for each block, and the test block was conducted without KR. Error bars show standard deviation. the control condition is shown as white circles and dashed lines, the narrow BW condition as white squares and solid lines, the wide BW condition as black squares and dashed lines, and the adjusted BW condition as black circles and solid lines.
Figure 6. The trends of VE (pretest–delay retention-test). Five trials were conducted for each block, and the test block was conducted without KR. Error bars show standard deviation. The control condition is shown as white circles and dashed lines, the narrow BW condition as white squares and solid lines, the wide BW condition as black squares and dashed lines, and the adjusted BW condition as black circles and solid lines.
Figure 7. The trends of the sum of ACEs outside of the BW (Blocks 1–3). Error bars show standard deviation. The narrow BW condition is shown as white squares and solid lines, the wide BW condition as black squares and dashed lines, and the adjusted BW condition as black circles and solid lines.
Data availability statement
The raw data included in the manuscript can be accessed from the corresponding author Jun Yabuki upon request through email: [email protected]