
Figures & data
Table 1. Means and standard deviations for blame and intentionality judgments towards each driver in Study 2.
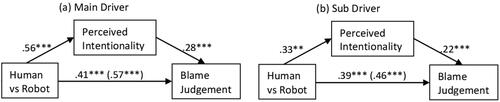
Figure 1. Mediation analyses with main driver and sub driver, respectively, in Study 2.
Note. ‘Human’ and ‘Robot’ were dummy coded as ‘1’ and ‘0’, respectively. For both main and sub drivers, the humanness effect on blame judgments was partially accounted for by the difference in perceived intentionality. Standardized coefficients are shown. Total effects are presented in parentheses. ***p < .001, **p < .01, *p < .05.
Figure 1 presents two panels of mediation paths: (a) Main Driver and (b) Sub Driver. Each panel illustrates the mediation effect through perceived intentionality from human vs robot to blame judgment.
Supplemental material
Supplemental Material
Download MS Word (89.8 KB)Data availability statement
The data and materials described in this article are openly available in the Open Science Framework at https://doi.org10.17605/OSF.IO/7V4UD.