Figures & data
Figure 1. Production system for license vehicle number plate production
Table 1. Arrival rate (λ) vs. process rate (μ) of jobs at the plants
Figure 2. Process time of the production lines
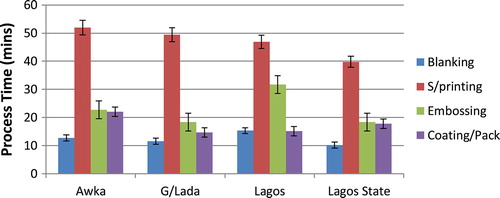
Table 2. Variability parameters of the plants
Table 3. Expected performance measures of the plants after pooling
Figure 3. Effect of variability reduction by pooling on average number of plates on queue for Gwagwalada plant
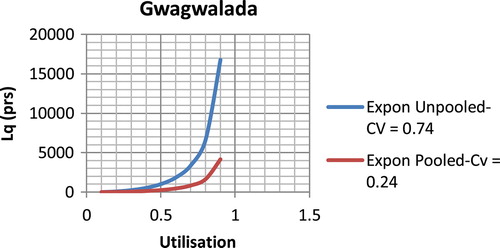
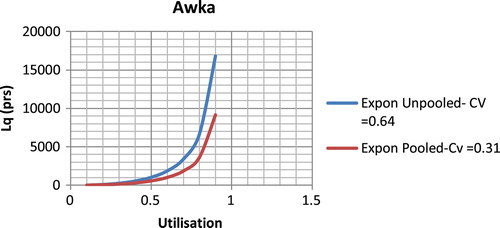
Figure 4. Effect of variability reduction by pooling on average number of plates in queue for Awka plant