Figures & data
Figure 1. Plot of resultant conductance and power against voltage for an ideal maximum power point tracking technique.
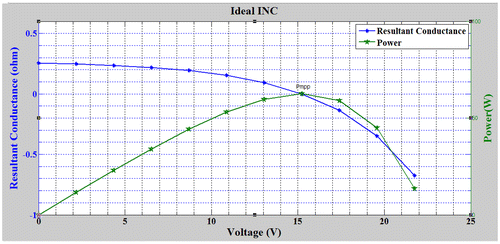
Figure 2. The equivalent circuit of PV cell with single diode.
Source: Adamo, Attivissimo, Di Nisio, Lanzolla, and Spadavecchia (Citation2009).
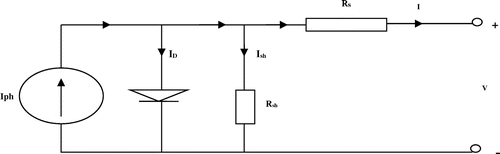
Table 1. The input and output parameters
Table 2. The resultant conductance (ϒ) and power varies with voltage at 1,000 W/m2 and 298 K (STC) for the proposed model
Table 3. The resultant conductance (ϒ) varies with voltage at varying Solar irradiance and temperature of 298 K for the proposed model
Table 4. Variation of resultant conductance with voltage at 1,000 W/m2 irradiance for varying temperatures for the proposed model
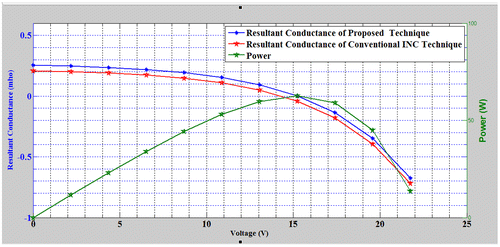
Table 5. Variation of resultant conductance with voltage at 600 w/m2 and 298 k for the proposed model and conventional incremental conductance technique
Figure 3. Plot of resultant conductance and power against voltage for the proposed model.
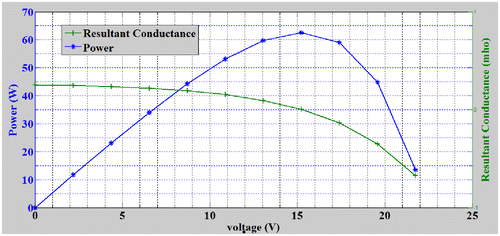
Figure 4. Plot of resultant conductance against voltage at different irradiance for the proposed model.
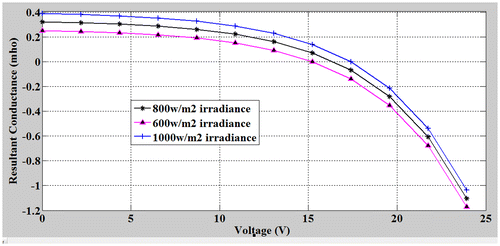
Figure 5. Plot of resultant conductance against voltage at different temperature for the proposed model.
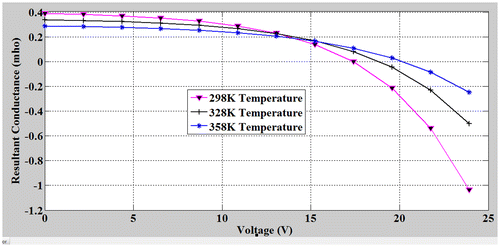
Figure 6. Plot of resultant conductance and power against voltage.