1,333
Views
8
CrossRef citations to date
0
Altmetric
Research Article

Intelligent GPS trace management for human mobility pattern detection

| (Reviewing Editor)
Article: 1390813 | Received 14 Aug 2017, Accepted 07 Oct 2017, Published online: 23 Oct 2017

Figures & data

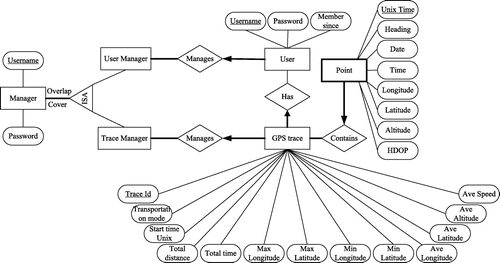
Figure 1. ER model of the GPS trace management system.

Figure 1. ER model of the GPS trace management system.

Figure 2. Logical model of the GPS trace management system.

Figure 2. Logical model of the GPS trace management system.

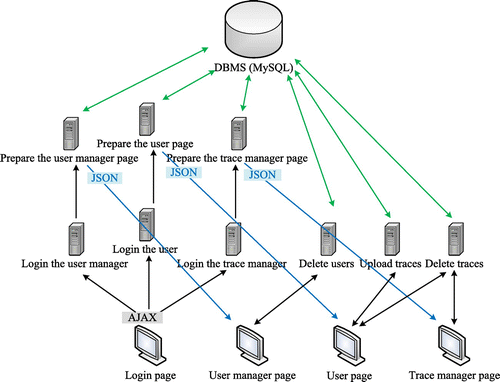
Figure 3. Client-server system.

Figure 3. Client-server system.

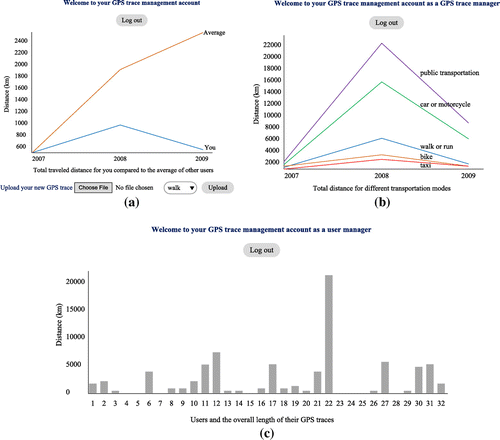
Figure 4. Front-end of the GPS trace management system: (a) user page, (b) trace manager page, (c) user manager page.

Figure 4. Front-end of the GPS trace management system: (a) user page, (b) trace manager page, (c) user manager page.

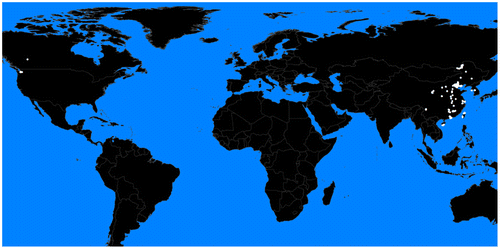
Figure 5. GPS traces from GeoLife project.

Figure 5. GPS traces from GeoLife project.

Table 1. Statistics of GPS traces for each user

Table 2. Statistics of GPS traces for each transportation mode

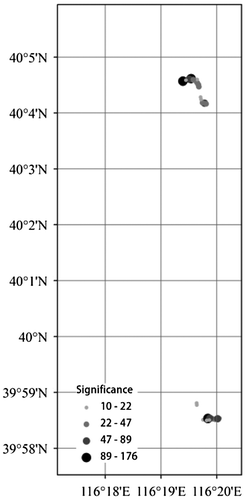
Figure 6. POIs over all transportation modes.

Figure 6. POIs over all transportation modes.

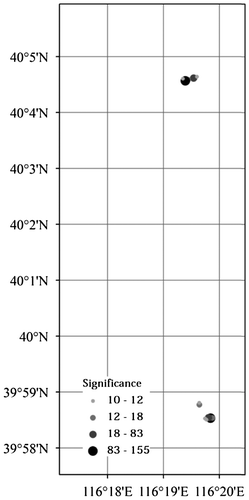
Figure 7. POIs over car GPS traces.

Figure 7. POIs over car GPS traces.

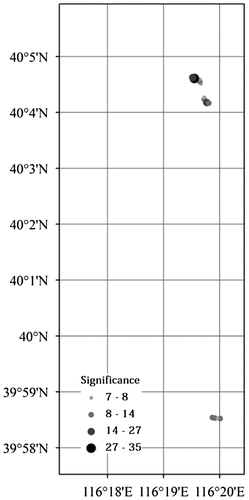
Figure 8. POIs over walking and running GPS traces.

Figure 8. POIs over walking and running GPS traces.

Figure 9. POIs over bus GPS traces.

Figure 9. POIs over bus GPS traces.

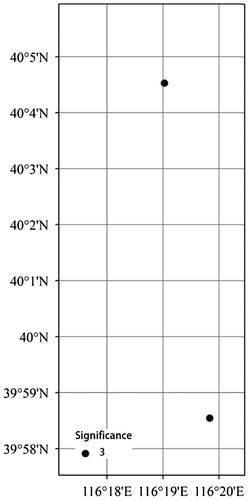
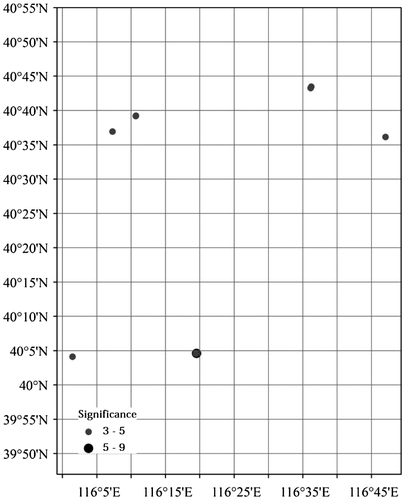
Figure 10. POIs over biking GPS traces.

Figure 10. POIs over biking GPS traces.

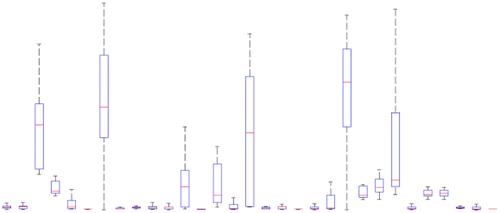
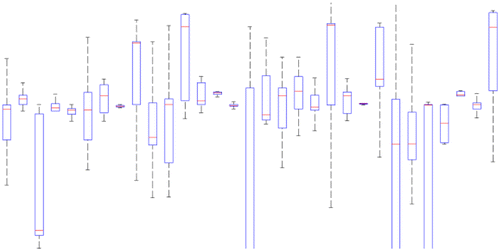
Figure 11. Box plot for sampling rate of walking GPS traces for different people.

Figure 11. Box plot for sampling rate of walking GPS traces for different people.

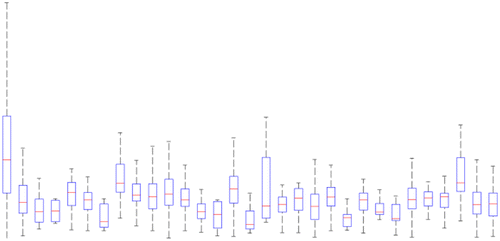
Figure 12. Box plot for speed of walking GPS traces for different people.

Figure 12. Box plot for speed of walking GPS traces for different people.

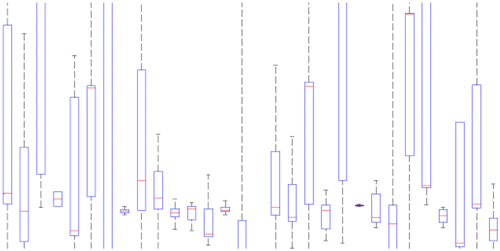
Figure 13. Box plot for longitude of walking GPS traces for different people.

Figure 13. Box plot for longitude of walking GPS traces for different people.

Figure 14. Box plot for latitude of walking GPS traces for different people.

Figure 14. Box plot for latitude of walking GPS traces for different people.

Table 3. Correlation coefficient between pairs of features.

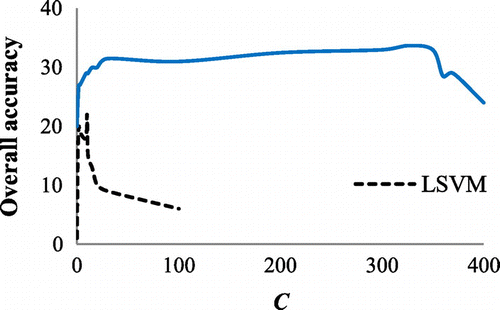
Figure 15. The overall accuracy of LSVM and NLSVM vs. the smoothing parameter (C).

Figure 15. The overall accuracy of LSVM and NLSVM vs. the smoothing parameter (C).

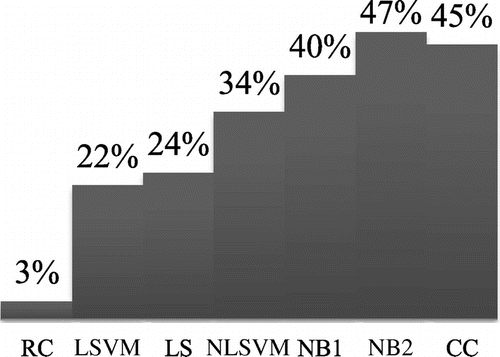
Figure 16. The overall accuracy of different classifiers.

Figure 16. The overall accuracy of different classifiers.

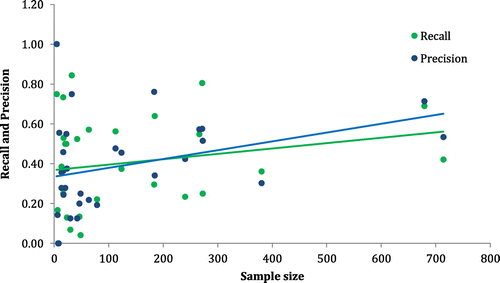
Figure 17. Sample size vs. recall and precision for different classes.

Figure 17. Sample size vs. recall and precision for different classes.