1,585
Views
6
CrossRef citations to date
0
Altmetric
Research Article

Blink reflex parameters in baseline, active, and head-impact Division I athletes

, , , , & | (Reviewing Editor) show all
Article: 1429110 | Received 26 Jun 2017, Accepted 11 Jan 2018, Published online: 02 Feb 2018

Figures & data

Figure 1. Blink reflexometer housing unit and software interface. Tubing connected to the left end of the housing unit delivers a puff of compressed air to the subject’s eyes.
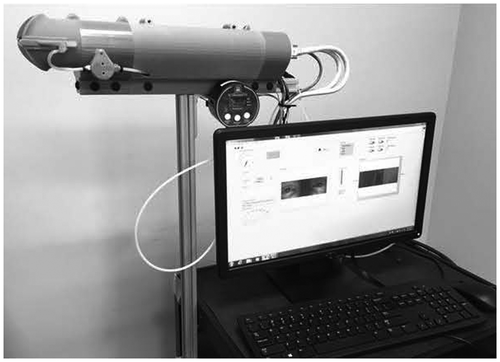
Figure 1. Blink reflexometer housing unit and software interface. Tubing connected to the left end of the housing unit delivers a puff of compressed air to the subject’s eyes.

Figure 2. Illustrations of time-displacement profiles of upper lid movement during and after a stimulated blink. (A) Baseline blink reflex time-displacement profile. (B) Blink reflex time-displacement profile after active play. Latency is increased. Differential latency is decreased. Log of number of oscillations is less. (C) Blink reflex time-displacement profile after a head impact causing a concussive event. Latency is decreased. Differential latency is increased. Log of number of oscillations is increased.
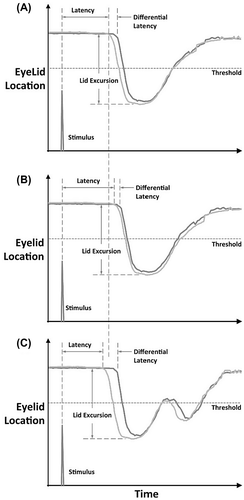
Note: Figures are not drawn to scale and changes are amplified for visibility.
Figure 2. Illustrations of time-displacement profiles of upper lid movement during and after a stimulated blink. (A) Baseline blink reflex time-displacement profile. (B) Blink reflex time-displacement profile after active play. Latency is increased. Differential latency is decreased. Log of number of oscillations is less. (C) Blink reflex time-displacement profile after a head impact causing a concussive event. Latency is decreased. Differential latency is increased. Log of number of oscillations is increased.

Figure 3. Blink reflex parameter changes from baseline due to active play or head impact.
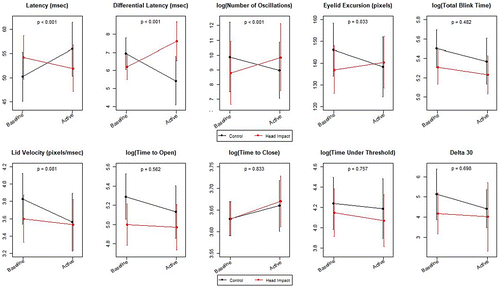
Notes: A positive slope indicates that the second measurement was increased on average relative to the baseline measurement. A negative slope indicates that the second measurement decreased relative to the baseline measurement. Black lines represent the mean values for control athletes at baseline and with activity and red lines represent the mean values for head impacted athletes at baseline and after head impact during activity. p-values are for the difference in the change in blink parameter between rest and activity between Control and Head Impacted athletes.
Figure 3. Blink reflex parameter changes from baseline due to active play or head impact.

Table 1. Estimated mean differences (and standard errors) within and between groups