Figures & data
Figure 1. Flowchart for wheeling cost calculation by power-flow based “line-by-line” methodology.
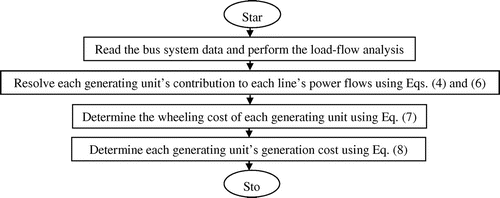
Figure 2. Flowchart for the unit commitment.
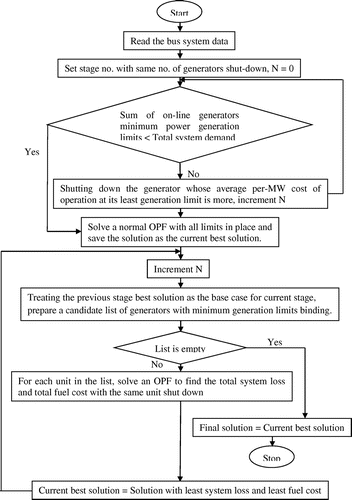
Table 1(a). Bus load data during the first twelve hours of a day
Table 1(b). Bus load data during the last twelve hours of a day
Table 2. Hour-wise network apparent power loss
Table 3. Hour-wise network active power loss comparison
Figure 3. Hour-wise network reactive power loss comparison.
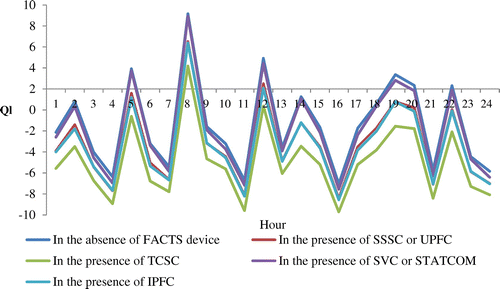
Figure 4. Net line reactance with the optimal placement of suitable TCSC and suitable SSSC.
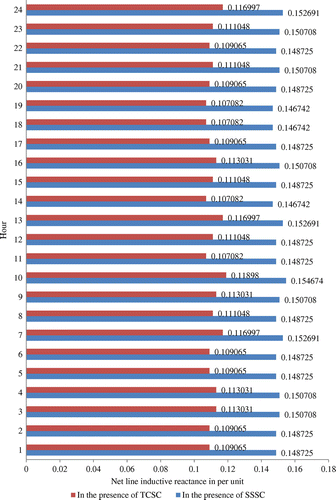
Table 4. Ratings of SVC and STATCOM
Table 5. Ratings of UPFC and IPFC
Figure 5. Slack bus generator daily generation costs.
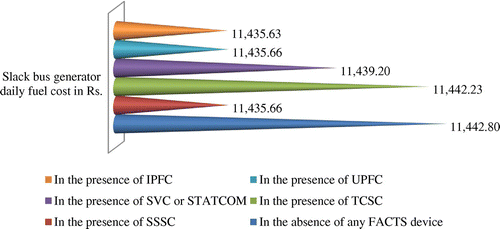
Table 6. Generator-wise daily wheeling costs
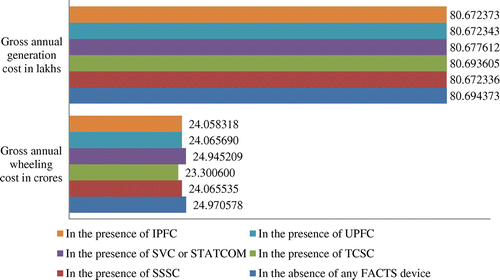
Figure 6. Comparison of gross annual generation and wheeling costs.
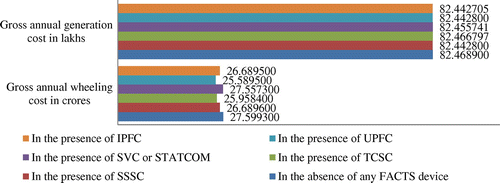
Table 7. Hour-wise network apparent power loss comparison under UC condition
Figure 7. Comparison of gross annual generation and wheeling costs under UC condition.