
Figures & data
Figure 1. Kenaf fibre particles.
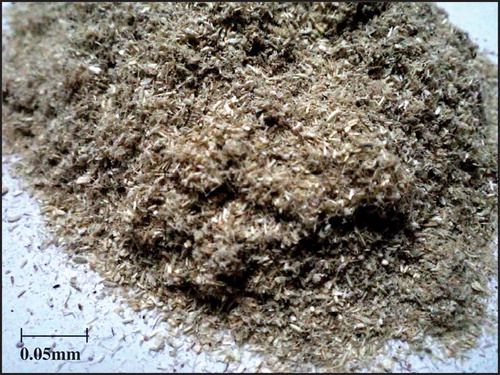
Table 1. Particle, resin and composite characteristics
Figure 2. Schematic illustration of a Pin-On-Disk (POD) tribo-machine.
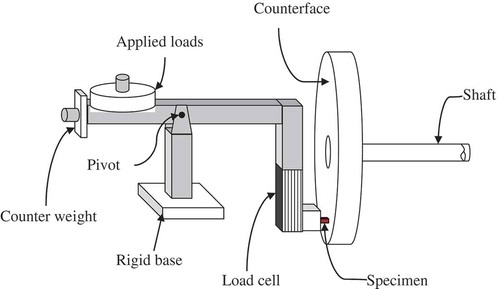
Figure 3. Average tensile strength for NE and KPafRE composite at different fibre particle weight percentages.
Figure 4. Average modulus of elasticity for NE and KPafRE composite at different fibre particle weight percentages.
Figure 5. Average flexural strength for NE and KPafRE composite at different fibre particle weight percentages.
Figure 6. Average flexural modulus for NE and KPafRE composite at different fibre particle weight fractions.
Figure 7. Average impact strength for NE and KPafRE composite at different fibre particle weight percentages.
Figure 8. Average compression strength for NE and KPafRE composite at different fibre particle weight percentages.
Figure 9. Average hardness for NE and KPafRE composite at different fibre particle weight percentages.
Figure 10. Average water absorption for NE and KPafRE composite at different fibre particle weight percentages.
Figure 11. Average Ws for NE and KPafRE composite during steady state transitions (5.0 km) at different particle weight fractions.
Figure 12. Average friction coefficient for NE and KPafRE composite during steady state transitions (3.36 km) at different particle weight fractions.
Figure 13. SEM images of KPafRE composites after tensile test.
(Remarks: Cr = Crack, MiDI = Minor Delamination, MaDl = Major Delamination, Vo = Voids, Re = Resinous Region, Fb = Fibrous Region)
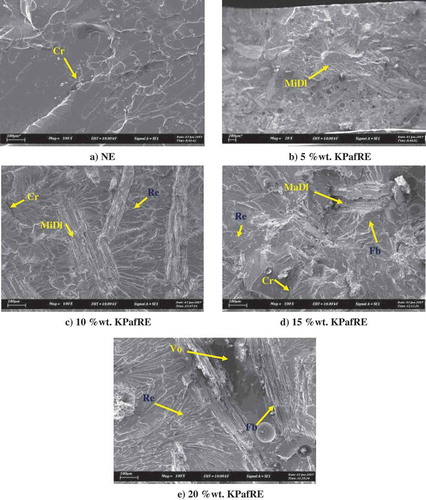
Figure 14. SEM images of KPafRE composites after flexural test.
(Remarks: Cr = Crack, MiDI = Minor Delamination, MaDl = Major Delamination, Deb = Debonding, Re = Resinous Region, Fb = Fibrous Region)
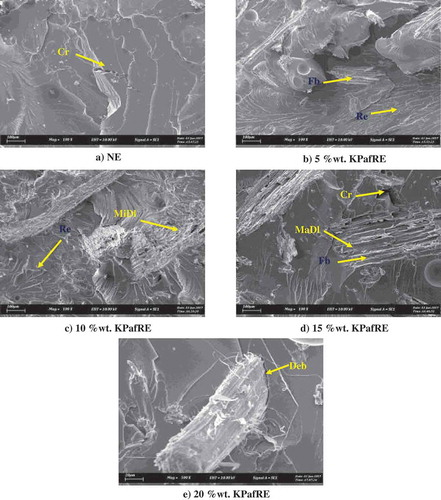
Figure 15. SEM images of KPafRE composites after impact test.
(Remarks: Cr = Crack, MiDI = Minor Delamination, MaDl = Major Delamination, De = Debonding, Re = Resinous Region, Fb = Fibrous Region)
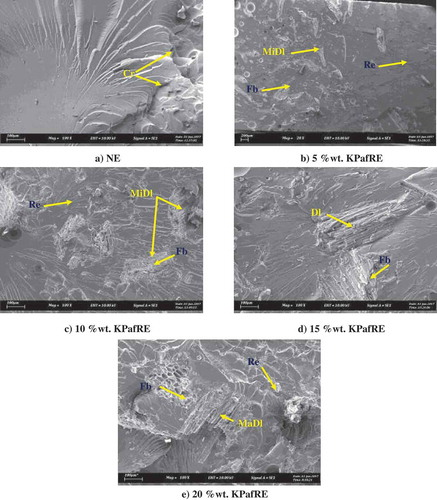
Figure 16. Optical photo micrographs of NE and KPafRE composite at 30 N applied loads subjected to 6.72 km sliding distances and 2.83 m/s counterface sliding velocity.
(Remarks: BFt = Back Film Transfer, Ws = Wear Scar, Pd = Plastic Deformation, Wd = Wear Debris, Fr = Fracture, Dl = Delamination, Cr = Crack, Ld = Large Debris, Df = Detached Fibre, Db = Debris, De = Debonding, Lf = Loose Fibre)
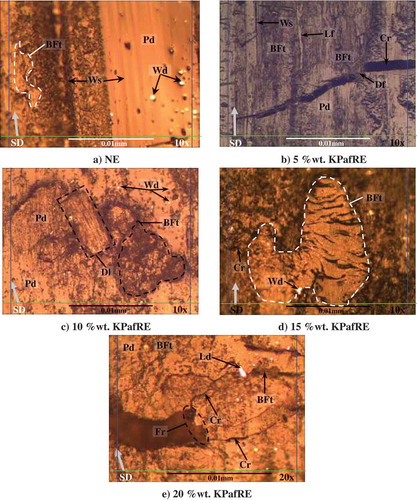
Figure 17. ANOVA results for tensile test.
Table 2. ANOVA results for mechanical tests
Table 3. Summary of 2-sample t-test results for mechanical tests
Figure 18. 2-sample t-test results for NE vs. 5%wt. KPafRE.
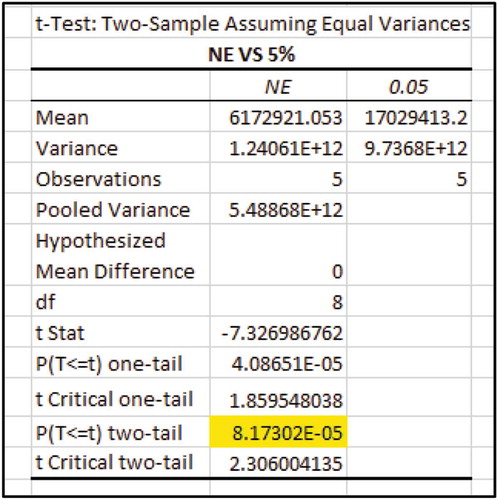
Table 4. Tensile, flexural and compressive properties of various natural and synthetic fibre based polymeric composites
Table 5. Impact energy and hardness properties of various natural and synthetic fibre-based polymeric composites
Table 6. Water absorption of various natural fibre-based polymeric composites
Table 7. Tribological properties of various natural and synthetic fibre-based polymeric composites