Figures & data
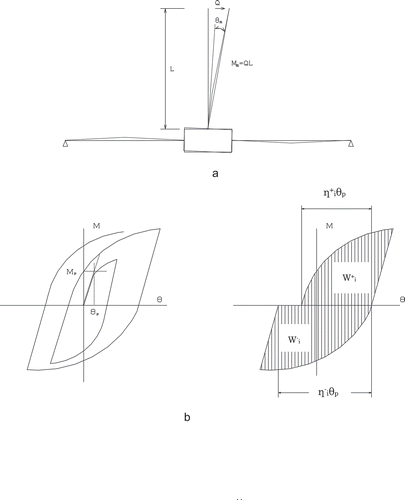
Figure 1. Specimen design.
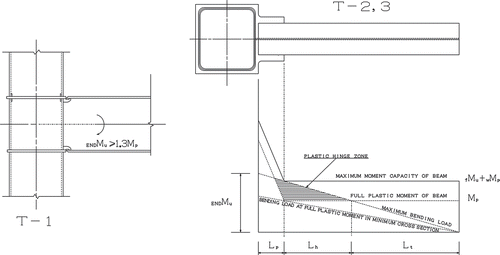
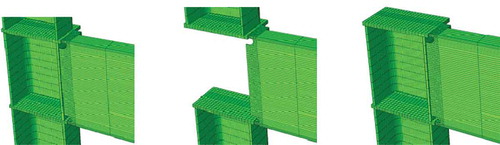
Figure 2. Connection details.
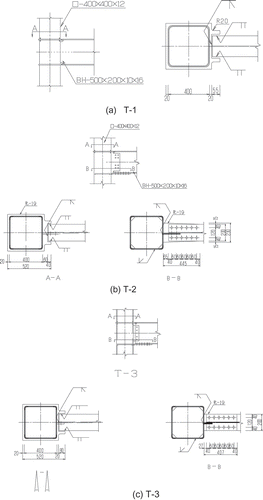
Table 1. Mechanical properties of materials
Figure 3. Test set-up.
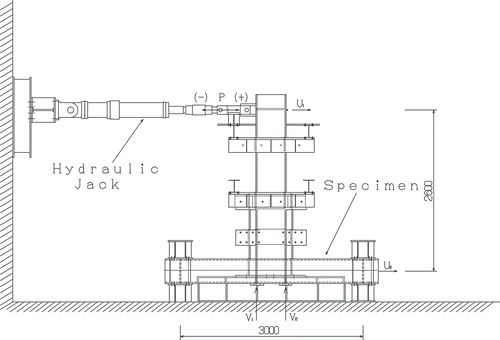
Table 2. Failure sequences of specimen T-1
Figure 4. Moment vs. beam rotation hysteric curves.
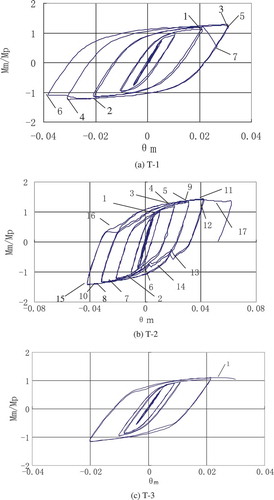
Figure 5. Tensile failure T-1.
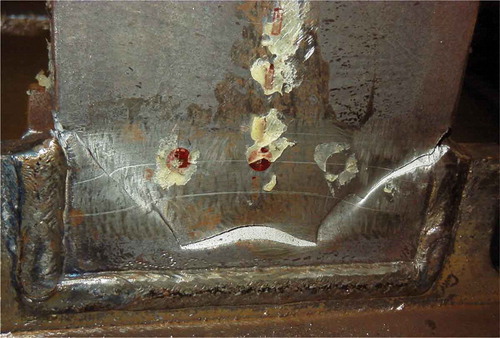
Figure 6. Local buckling observed in T-2.
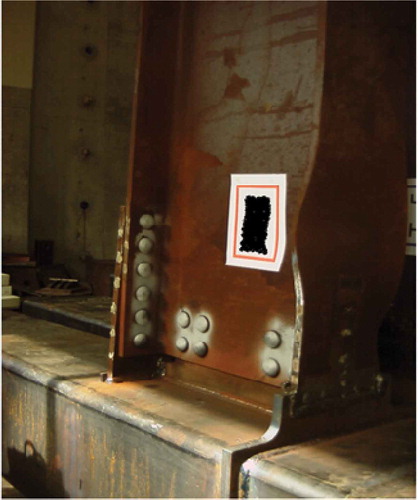
Figure 7. the flange plate rupture (T-3).
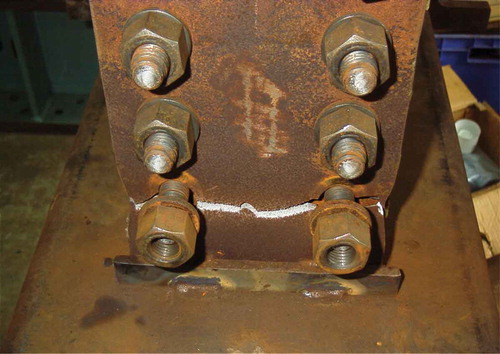
Figure 8. Dissipated energy during load cycling.
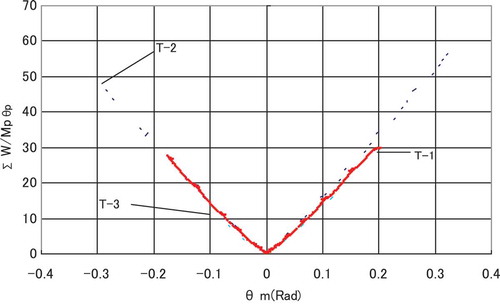
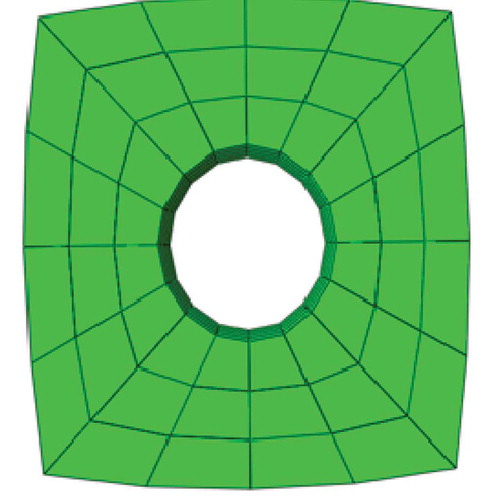
Figure 9. Finite element mesh.
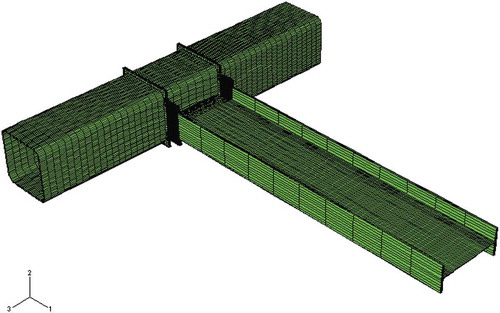
Figure 10. Detail mesh of bolted connection.
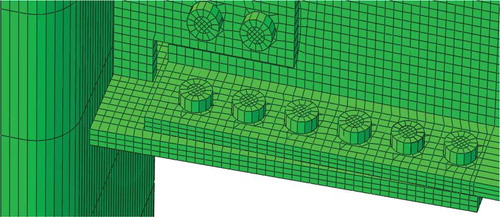
Figure 11. Mode components (T-1).
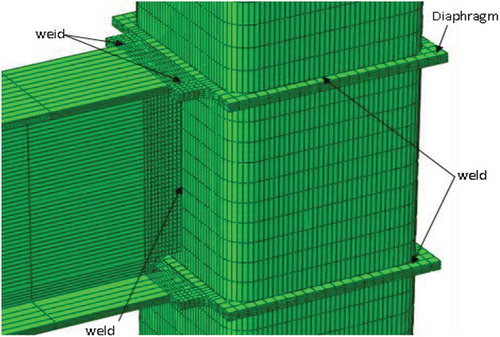
Figure 12. Mode components (T-2).
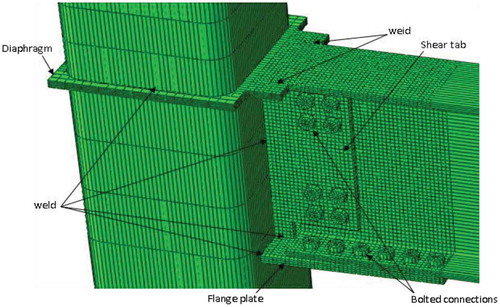
Figure 13. Finite element model of bolt.
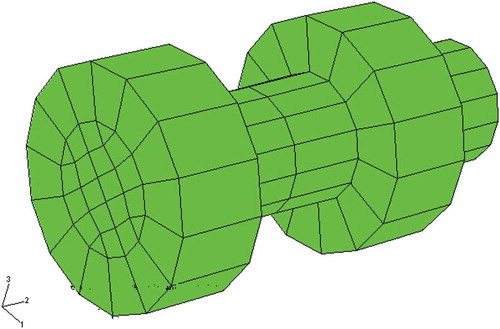
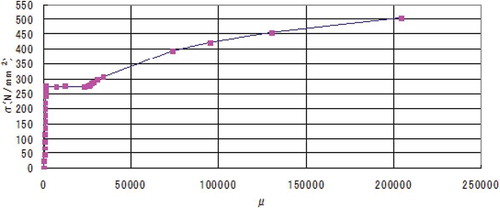
Figure 14. Steel stress–strain curve.
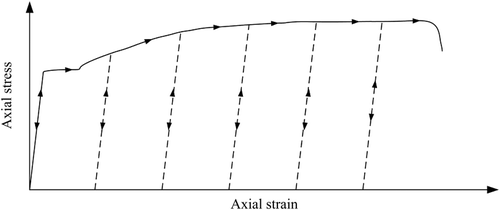
Figure 15. Hysteresis curves (T-1).
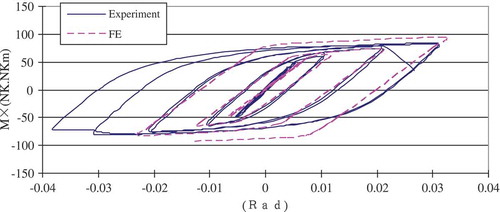
Figure 16. Hysteresis curves (T-2).
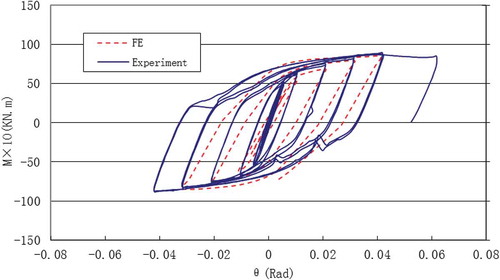
Figure 17. Hysteresis curves (T-3).
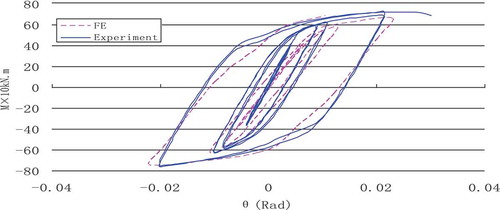
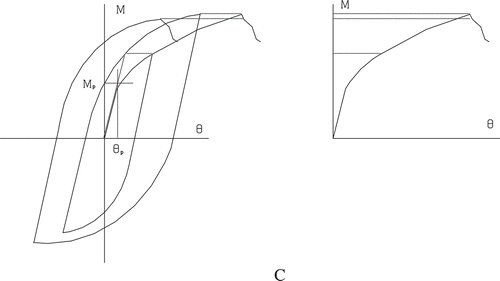
Figure 18. Moment–rotation relationships.
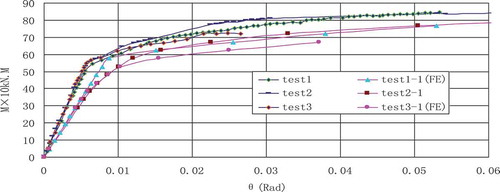
Figure 19. T-1 Moment–rotation relationships.
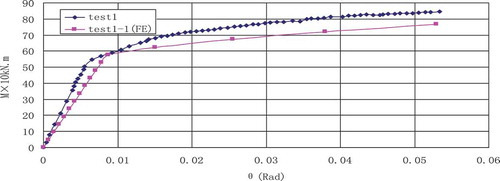
Figure 20. T-2 Moment–rotation relationships.
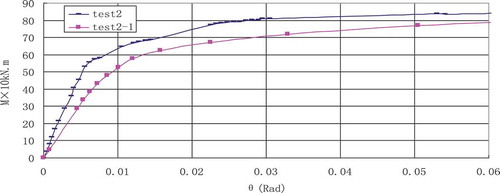
Figure 21. T-3 Moment–rotation relationships.
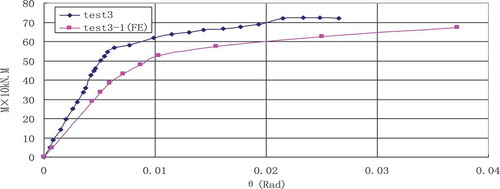
Figure 22. T-1 Plastic strain distribution.
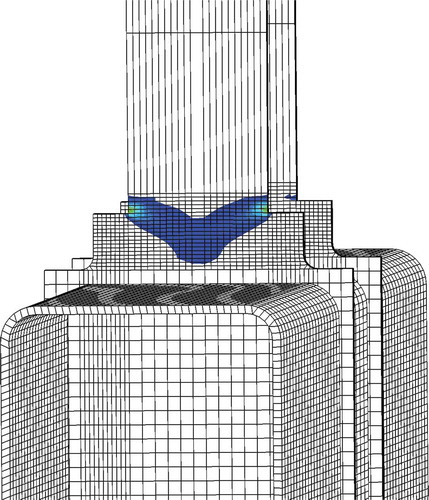
Figure 23. FE analyses result of the beam top flange buckling (T-2).
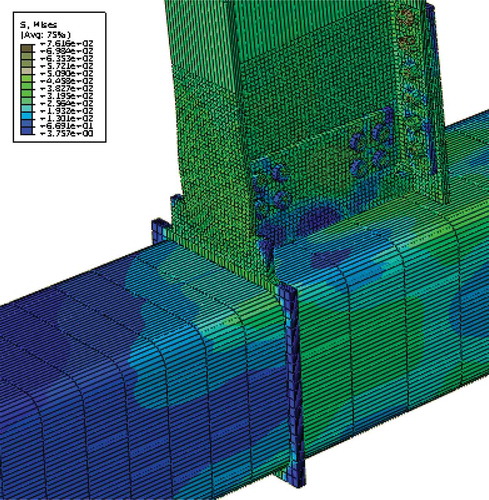
Figure 24. T-3 Plastic strain distribution under the cyclic load.
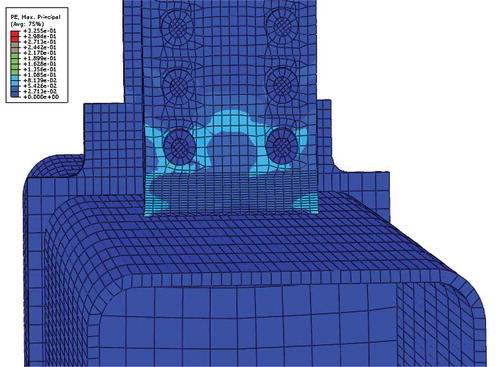
Figure 25. T-2 Plastic strain distribution under the cyclic load.
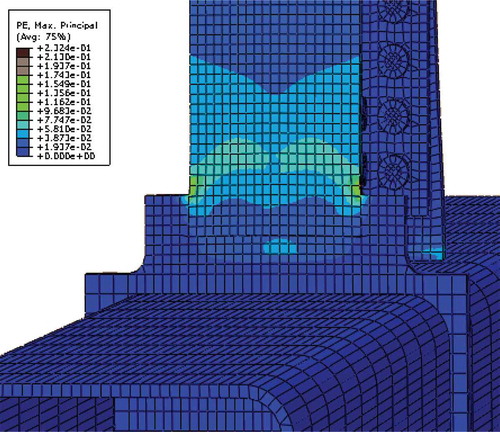
Figure 26. Distribution of pressure between the flange-plate and beam bottom flange caused by bolt pretension force.
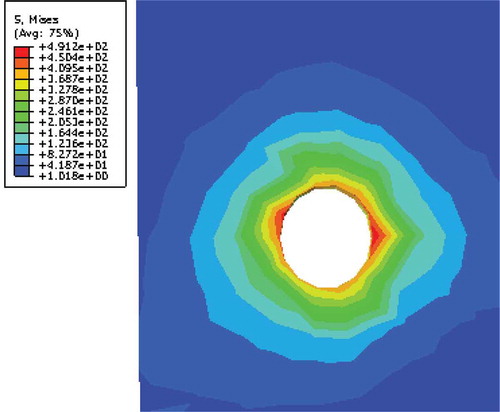
Figure 27. Distribution of force between the flange-plate and beam bottom flange at the ultimate load (T-2).
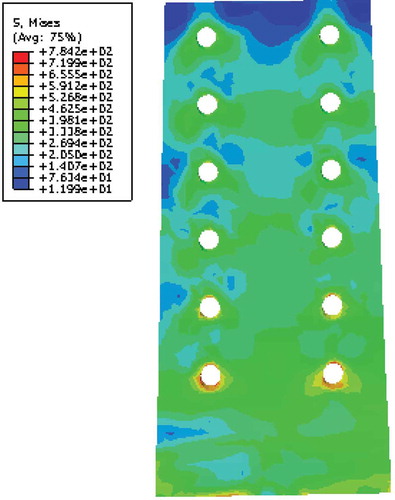
Figure 28. Distribution of force between the flange-plate and beam bottom flange at the ultimate load (T-3).
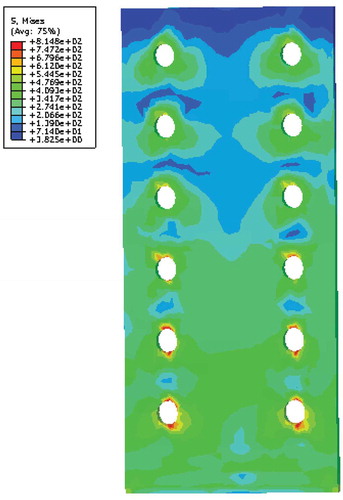
Figure 29. Fracture paths at the beam end in tests.
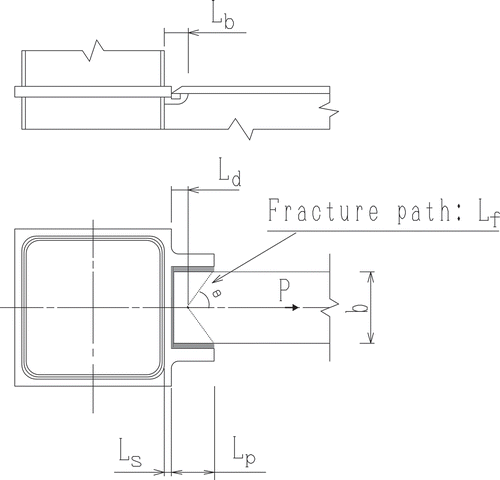
Figure 30. Proposed fracture paths at the beam end.
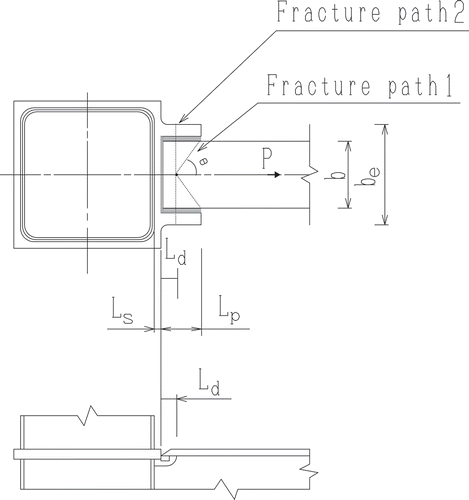
Figure 31. Moment carried by welded web joint.
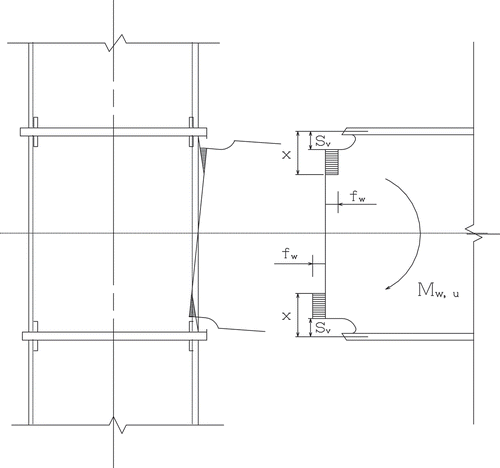
Figure 32. Details of the flange–plate connection.
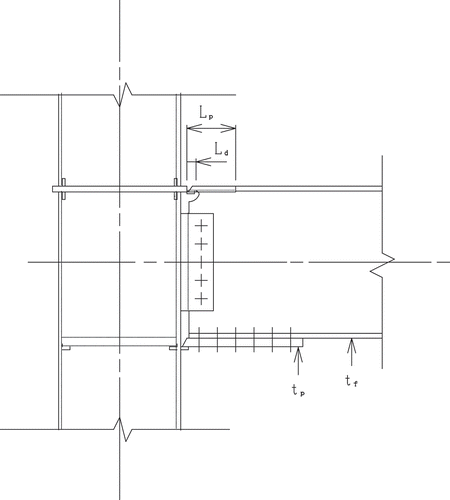
Table 3. Failure sequences of specimen T-2
Table 4. Failure sequences of specimen T-3
Table 5. The tensile capacity comparison between the test and prediction results