Figures & data
Figure 13. SMS communication between the two test phones.
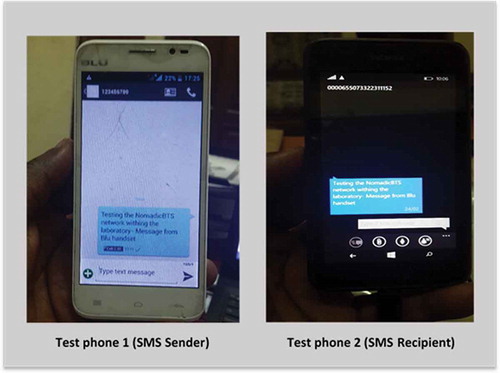
Figure 1. NomadicBTS architecture and interconnections with traditional GSM and PSTN.
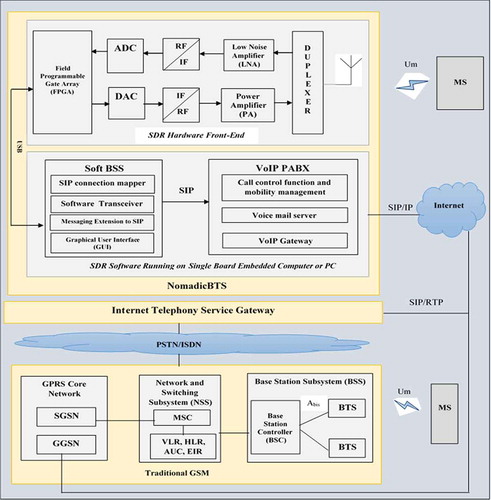
Figure 2. The NomadicBTS prototype cell in the laboratory.
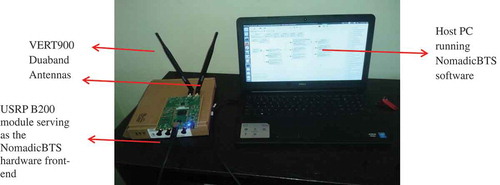
Figure 3. Electromagnetic spectrum (Stewart, Barlee, Atkinson, & Crockett, Citation2015).
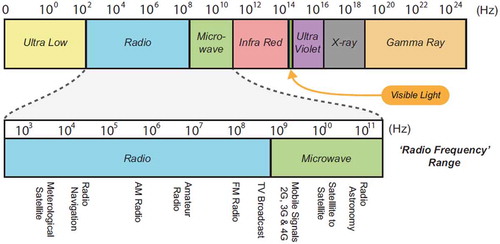
Table 1. USRP parameters (Ettus, Citation2008)
Figure 4. Default configurations of the USRP B200 module.
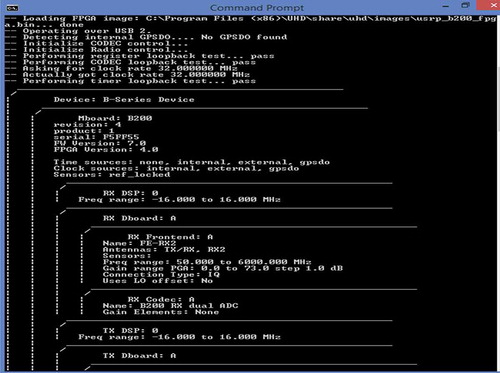
Figure 5. Latency test result.
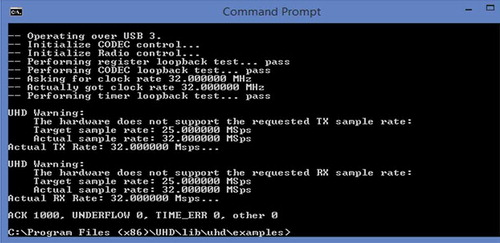
Figure 6. Coercion test result.
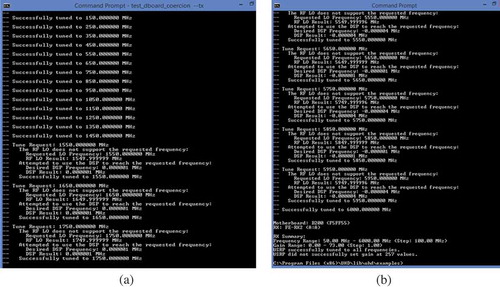
Figure 7. Benchmark test result.
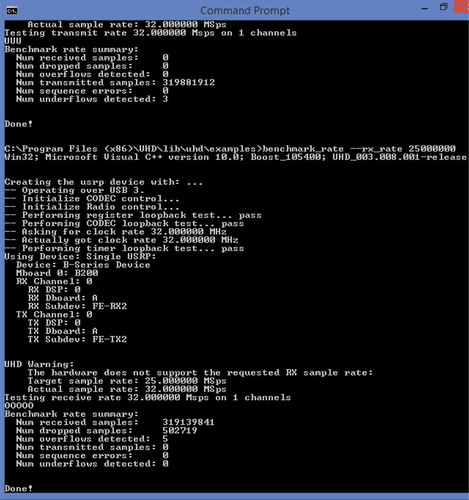
Figure 8. Spectrum of received signal by USRPB200 for the frequency ranges: (a) 936–944 MHz and (b) 942–950 MHz.
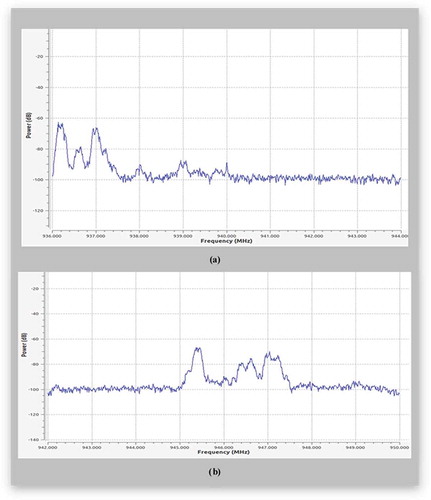
Figure 9. Spectrum of received signal by USRP B200 for the frequency ranges: (a) 947–955 MHz and (b) 952–960 MHz.
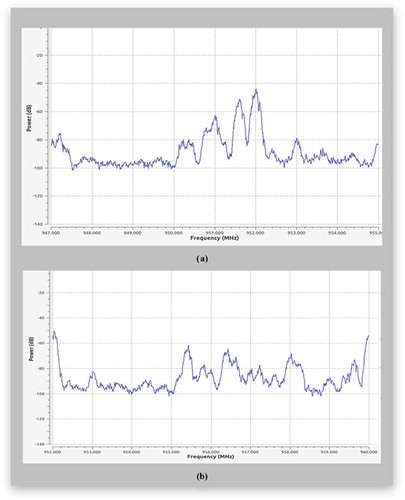
Table 2. Description of ASU integer values
Figure 10. NomadicBTS signal measurement at close proximity (30 cm) with one of the test mobile phones using Network Signal Info Pro mobile app.
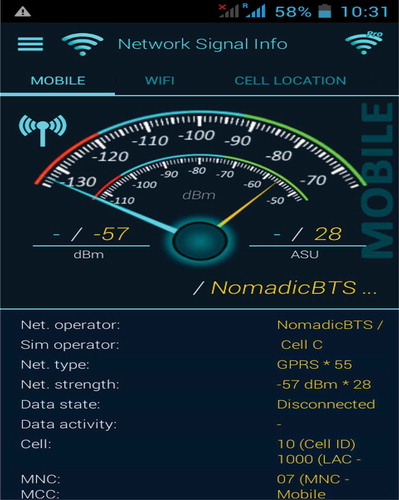
Figure 11. Google earth view of the NomadicBTS prototype cell location and the measured signal strengths.
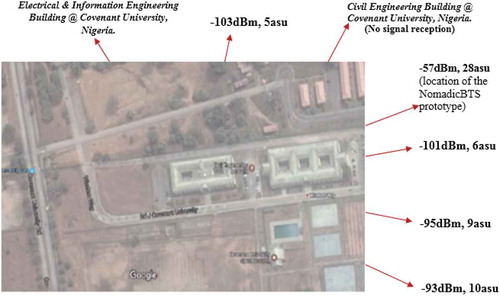
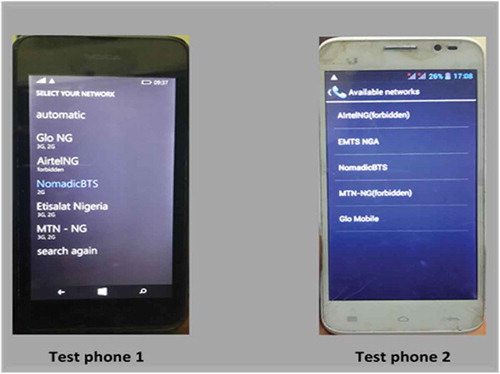
Figure 12. Established connection with the NomadicBTS prototype cell by the two test phones.