Figures & data
Figure 1. Strengthening technique (a) EBR (b) NSM and (c) externally bonded using nails (Kim & Heffernan, Citation2008).
Figure 2. Single-shear test (Bilotta et al., Citation2011).
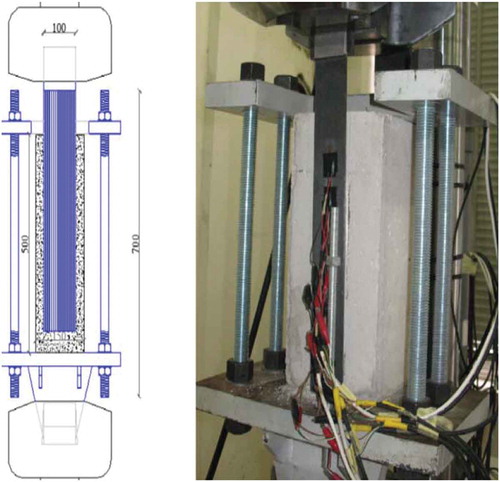
Figure 3. Double-shear test (Serbescu et al., Citation2013).
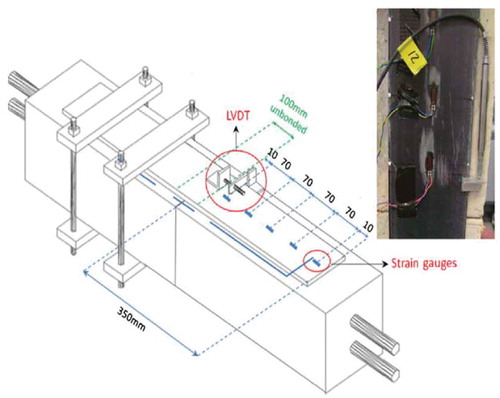
Figure 4. Beam specimen set-up (Pan & Leung, Citation2007).
Figure 5. Strain distribution under various loads (a) GFRP (b) CFEP and (c) GFRP versus CFRP.
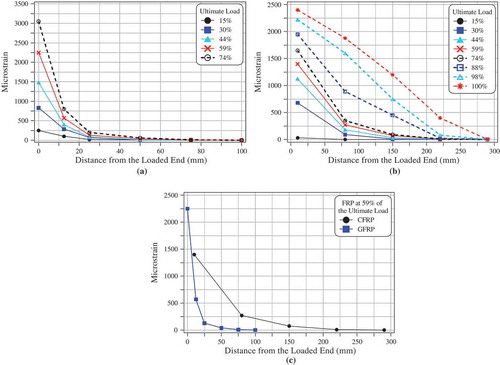
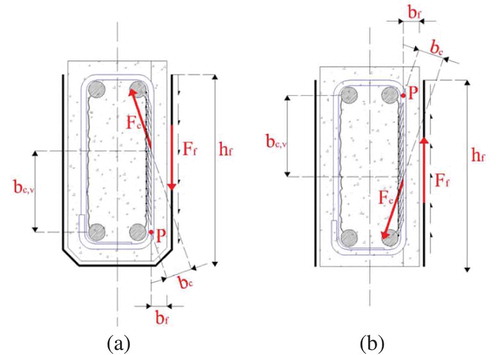
Figure 6. Failure plane (a) Externally bonded FRP and (b) Near-surface mounted NSM (Seracino et al., Citation2007).
Figure 7. Specimen used to determine durability via half immersing (Amidi & Wang, Citation2016a).
Figure 8. Testing specimen (Amidi & Wang, Citation2016b).
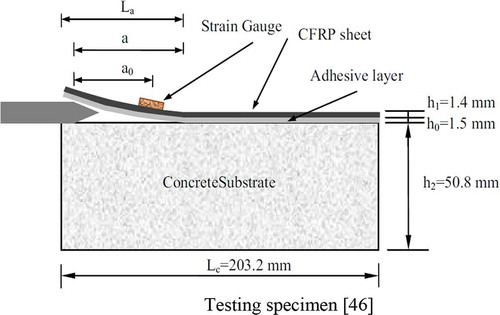
Figure 9. Crack induced in the untreated interface (a) SEM image of the interface soaked in water for 7 days; (b) carbon mapping image; and (c) oxygen mapping image (Amidi & Wang, Citation2016b).
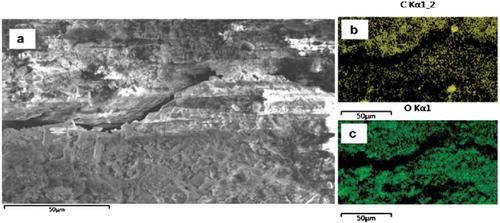
Figure 10. Interface treated with Silane (a) SEM image does not show any crack; (b) carbon mapping image; and (c) oxygen mapping image (Amidi & Wang, Citation2016b).
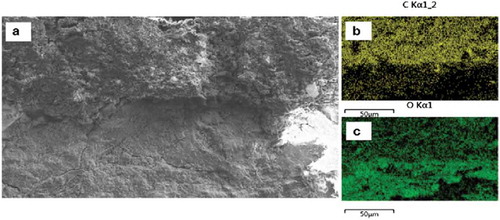
Figure 11. Bond stress–slip relationships (a) cut-off type; (b) elasto-plastic type; and (c) tensile softening type: bilinear type (left) and Popovics type (right) (Ko et al., Citation2014).
Figure 12. Comparison between proposed local bond stress–slip models.
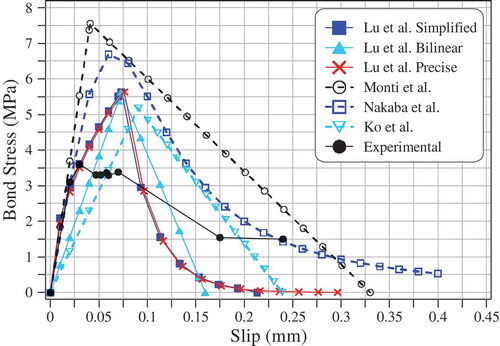
Figure 13. Comparison between normalized local bond stress–slip models and experimental results.
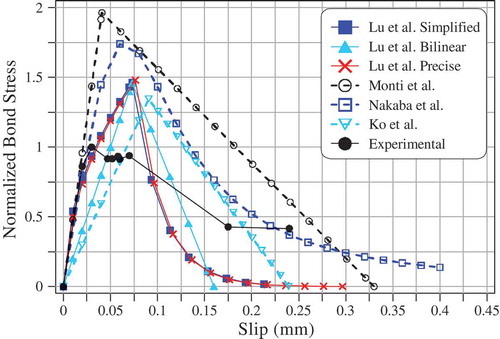
Figure 14. Side section for the end anchoring system (Chahrour & Soudki, Citation2005).
Figure 15. Spike fibre (a) concrete strengthened with FRP anchors and (b) FRP anchors (Zhang & Smith, Citation2012; Zhang et al., Citation2017).
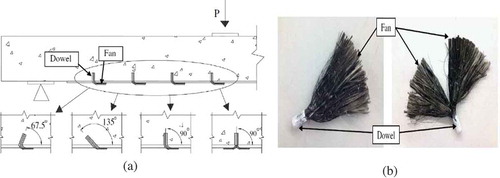
Figure 16. Total applied load versus mid-span deflection (Maghsoudi & Bengar, Citation2011).
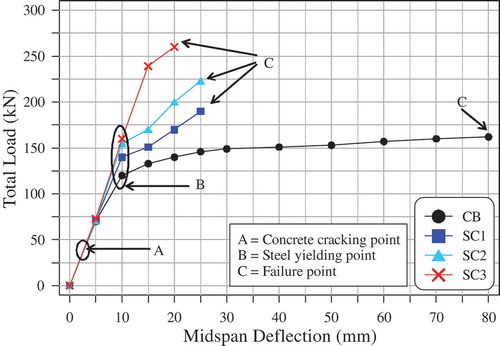
Figure 17. Bending moment versus crack width (Maghsoudi & Bengar, Citation2011).
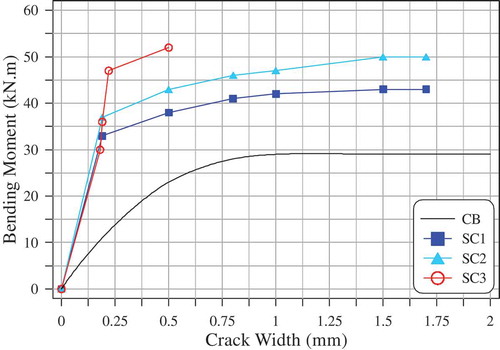
Figure 18. Fatigue failure sequence of FRP-strengthened concrete beam (Kim & Heffernan, Citation2008).
Figure 19. Relation between number of loading cycles and steel stress range.
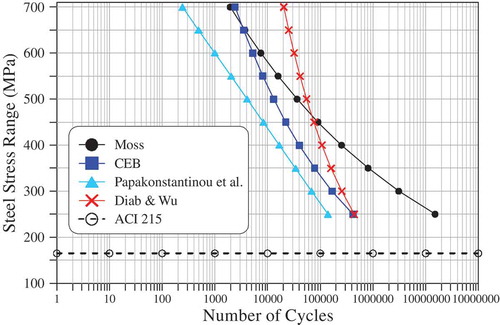
Figure 20. Debonding failure types (a) plate-end debonding and (b) intermediate crack (IC) (Yao et al., Citation2005).
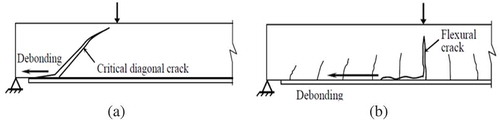
Figure 21. Numerical prediction versus test results (ζ = 0.005, t0/T1 = 10 for dumping solutions) (Chen, Teng, Chen, & Xiao, Citation2015).
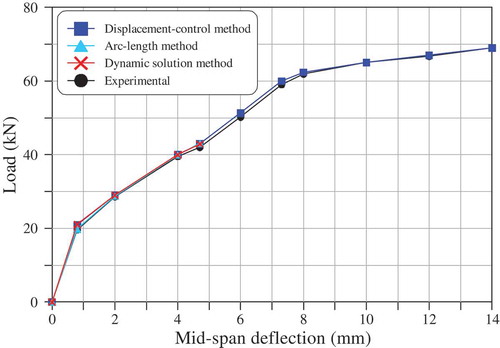
Figure 22. Force acting on FRP and concrete surface (a) U-wrapped FRP and (b) side-bonded (Pellegrino & Modena, Citation2008).