Figures & data
Table 1. Compressor rotor blade design Data (Reid & Moore, Citation1978 )
Figure 1. Blade basic coordinates representation Hossein (Citation2017).
Figure 2. ANYS geometrical model of rotor 36 blades.
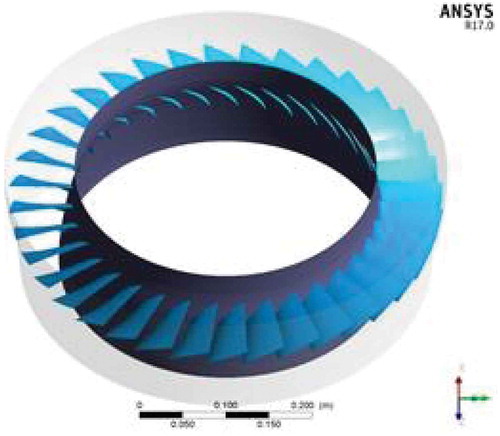
Figure 3. Geometrical details of rotor blade in ANSYS®.
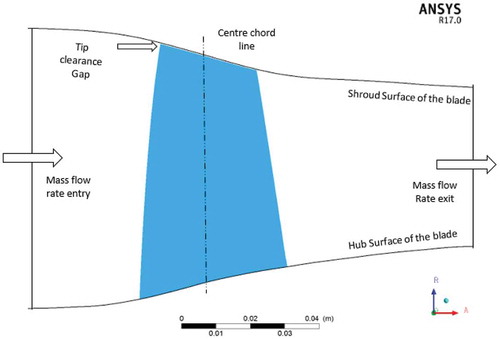
Figure 4. Representation of mesh elements on compressor stages.
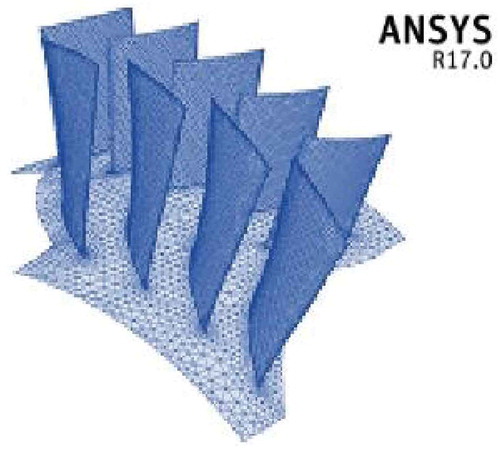
Figure 5. Representation of mesh elements near the leading edge and trailing edge in ANSYS®.
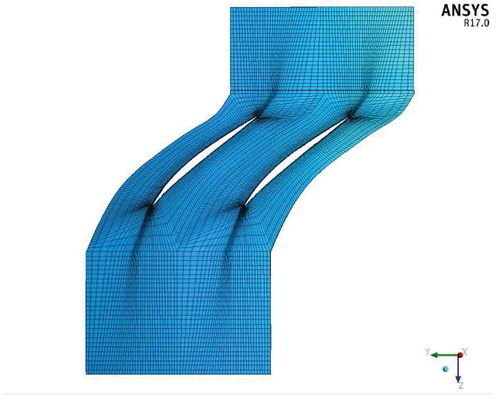
Figure 6. 100% design speed, mesh independence check of rotor 37.
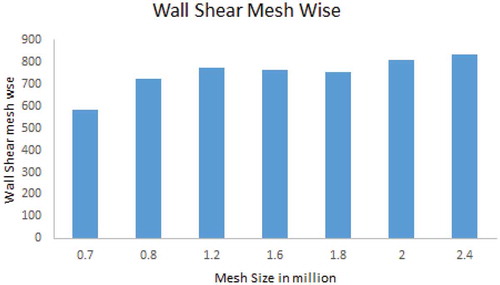
Figure 7. 100% design speed for the complete flow domain with stage model Y+ values along with the mesh size.
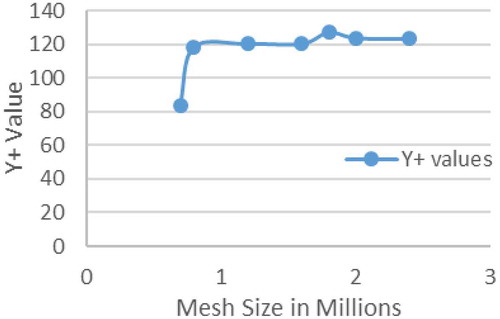
Table 2. Boundary Conditions
Figure 8. Validation of compressor pressure ratio Hossein (Citation2017).
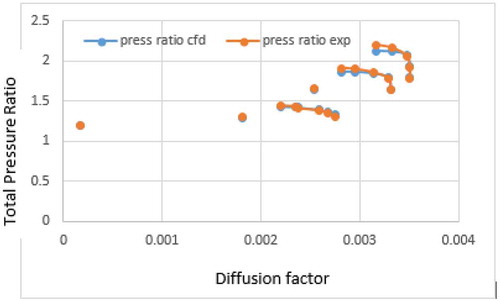
Figure 9. 100% design speed, adiabatic efficiency of rotor 37.
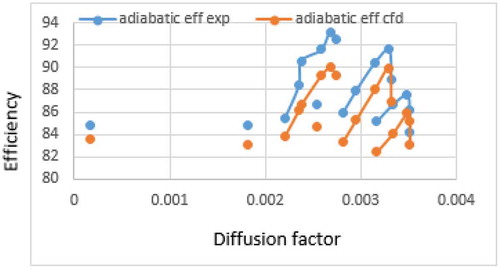
Figure 10. 100% design speed, grid independency check validation of rotor 37 efficiency.
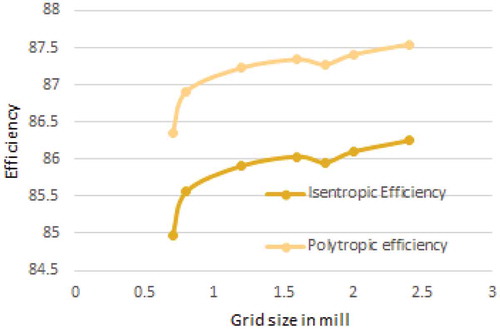
Figure 11. 100% design speed, mass flow rate of rotor 37.
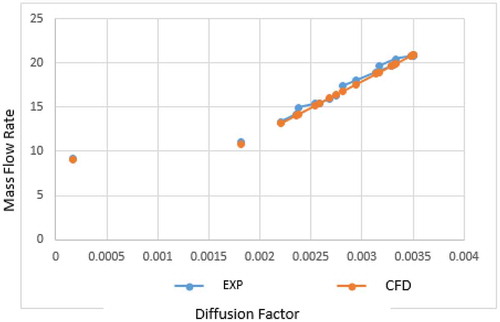
Figure 12. 100% design speed, temperature ratio of rotor 37.
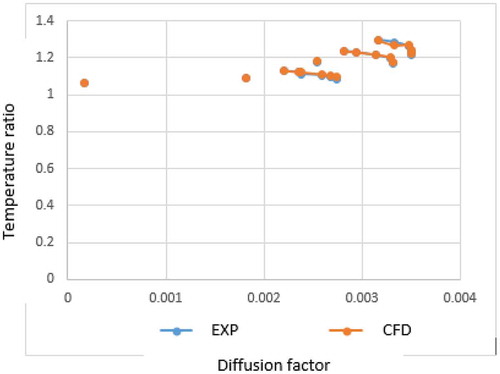
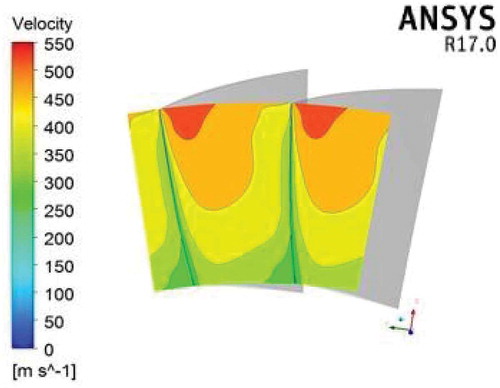
Figure 13. Velocity distribution across the stage at Mach 0.8.
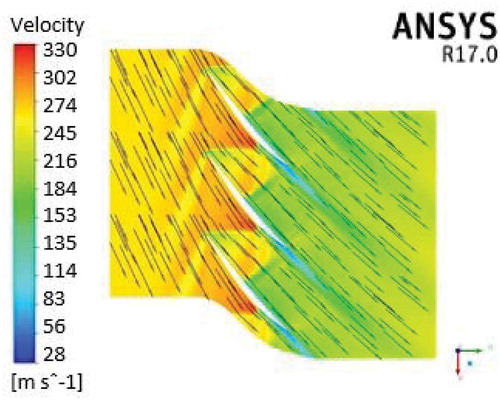
Figure 14. Velocity distribution across the stage at Mach 1.0.
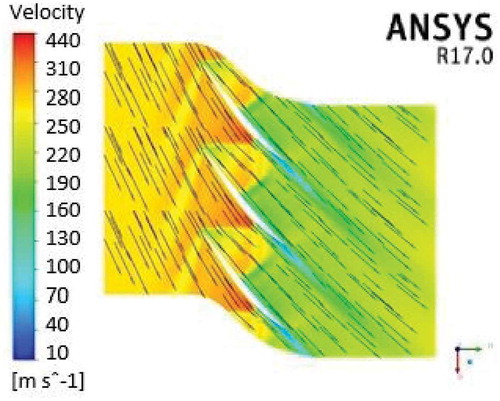
Figure 15. Velocity distribution across the stage at Mach 1.2.
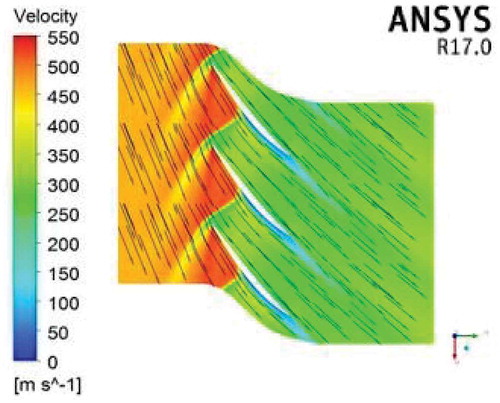
Figure 16. Pressure distribution across the blade streamwise direction at Mach 08, 1.0 and 1.2.
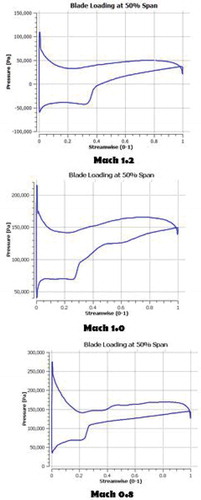
Figure 17. Pressure distribution on rotor blade suction side at Mach 0.8.

Figure 18. Pressure distribution on rotor blade pressure side at Mach 0.8.
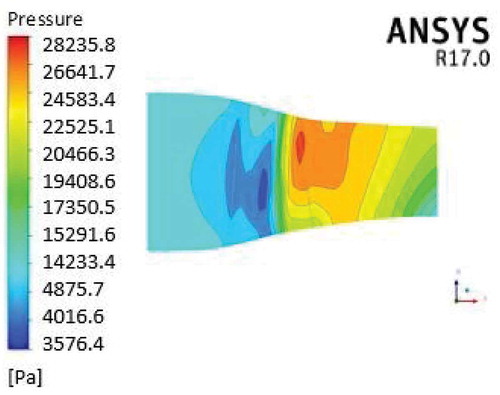
Figure 19. Pressure distribution on rotor blade suction side at Mach 1.0.
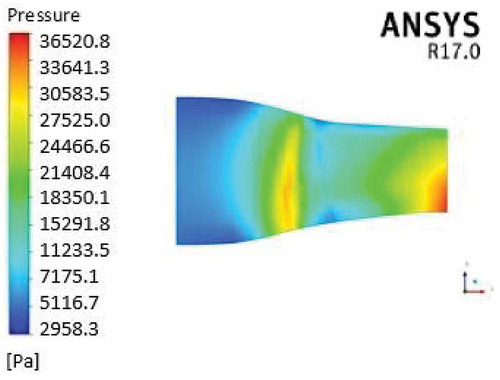
Figure 20. Pressure distribution on rotor blade pressure sides at Mach 1.0.
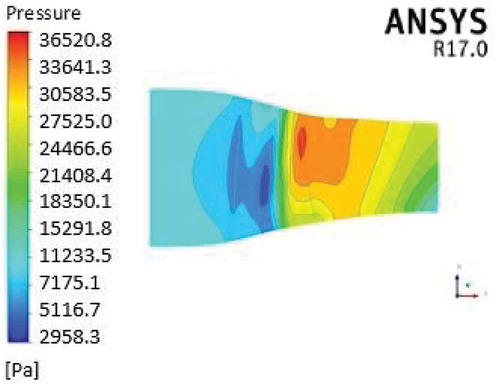
Figure 21. Pressure distribution on rotor blade suction side at Mach 1.2.
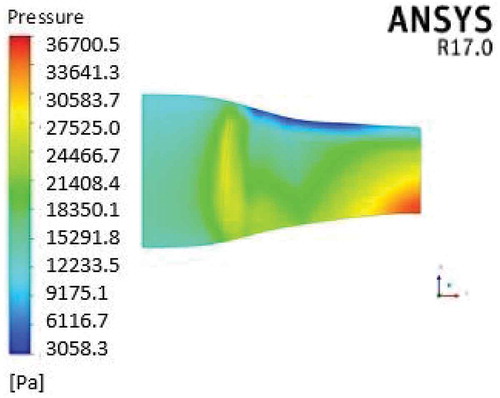
Figure 22. Pressure distribution on rotor blade pressure side at Mach 1.2.
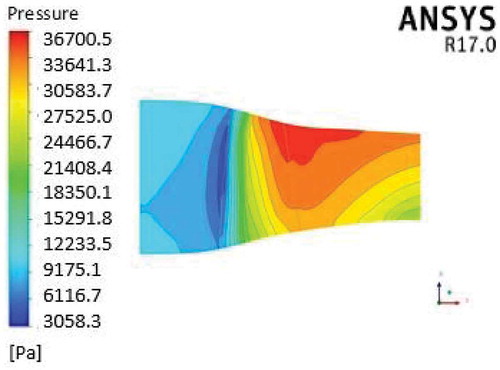
Figure 23. Mach number distribution on stage at Mach 0.8.
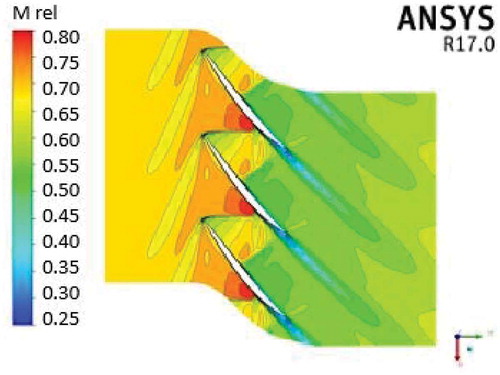
Figure 24. Mach number distribution on stage at Mach 1.0.
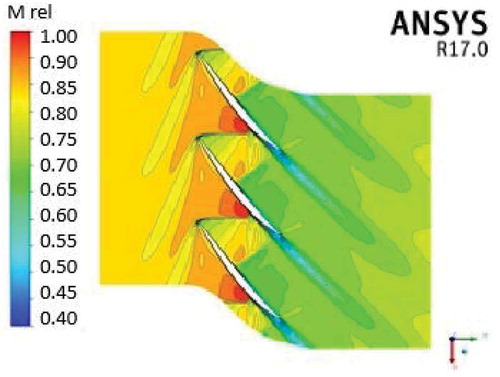
Figure 25. Mach number distribution on stage at Mach 1.2.
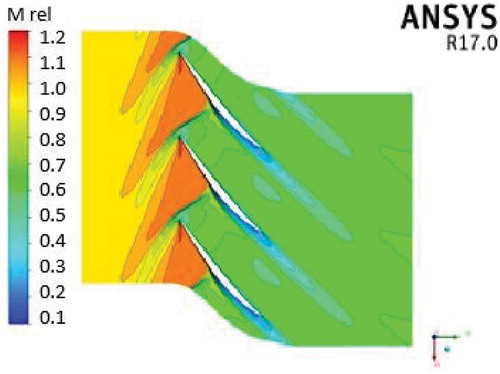
Figure 26. Vortex flow near the tip of the rotor blade at Mach 0.8.
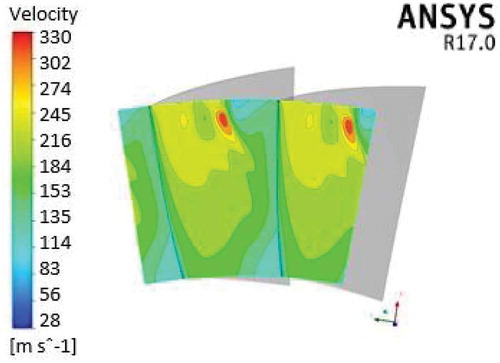
Figure 27. Vortex flow near the tip of the rotor blade at Mach 1.0.
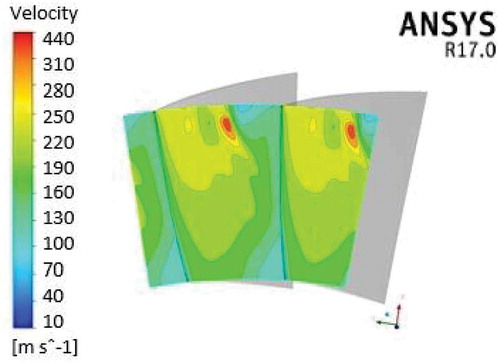
Figure 28. Vortex flow near the tip of the rotor blade at Mach 1.2.