Figures & data
Table 1. The parameter of VAR (1) and VMA (1)
Table 2.
The ARL of the proposed control chart for VAR (1) data with
Table 3.
The ARL of the proposed control chart for VAR (1) data with
Table 4.
The ARL of the proposed control chart for VMA (1) data with
Table 5.
The ARL of the proposed control chart for VMA (1) data with
Figure 1. The ARLs comparison of the proposed control chart for (a) VAR (1) and (b) VMA (1) data.
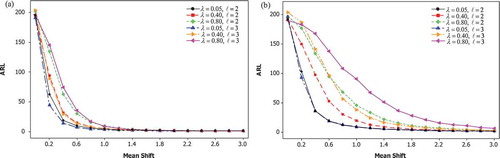
Figure 2. Time series plots of (a) hourly water turbidity data and (b) hourly chlorine residual data in Phase I.
Figure 3. MLS-SVR-based MEWMA control chart for water quality data in Phase I.
Figure 4. Time series plots of (a) hourly water turbidity data and (b) hourly chlorine residual data in Phase II.
Figure 5. MLS-SVR-based MEWMA control chart for water quality data in Phase II.
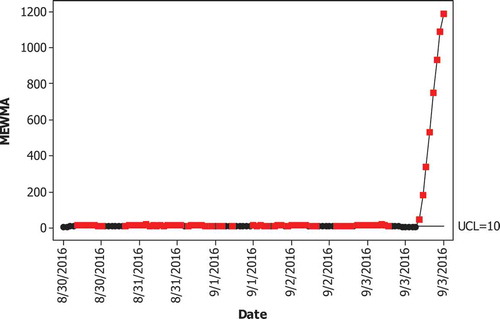
Figure 6. Time series plots of (a) updated hourly water turbidity data and (b) updated hourly chlorine residual data in Phase II.
Figure 7. MLS-SVR-based MEWMA control chart for updated water quality data in phase II.