Figures & data
Figure 1. Dimensions of surface textures under investigation (Texture A—smooth surface, Texture B and C—rough surface, Texture D—very rough surface) (reproduced from Mohamad Hanif et al. (Citation2015)).
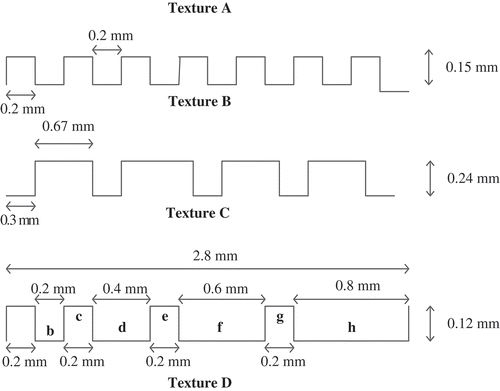
Table 1. Descriptions of the vibration patterns and their associated surface textures
Figure 2. Brass clip as a mechanical mounting for the vibration motor. Dashed red line is the middle area of the platform where the motor was glued. Both end sides of the platform are thicker than the rest of the platform. The velcro band was weaved between the four slots (reproduced from Mohamad Hanif (Citation2015)).
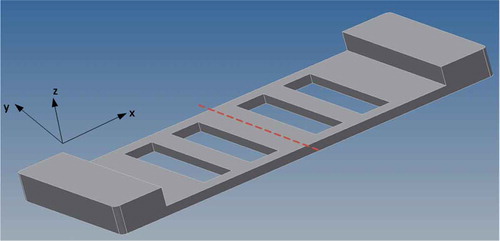
Figure 3. FFT output of the vibration stimuli.
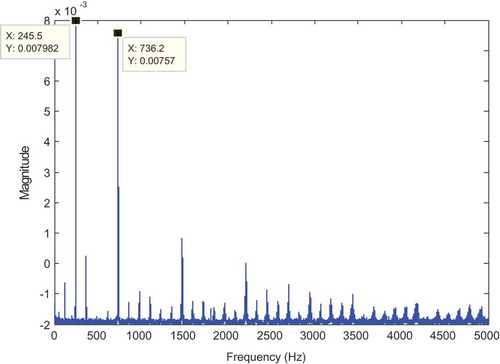
Figure 4. Vibration device.
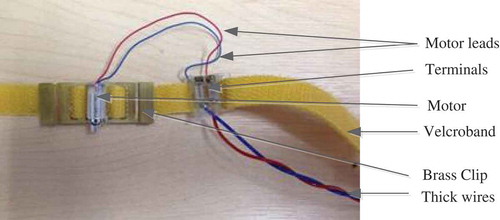
Figure 5. Positions of the vibration stimuli, surface textures and other test apparatus for the psychophysical test.
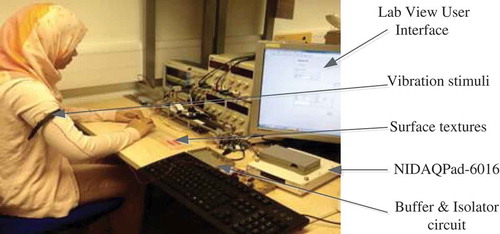
Figure 6. Histogram of selected surface textures with supplied vibration patterns.
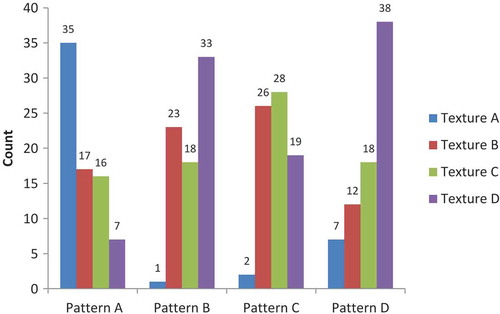
Figure 7. Histogram of the follow-up analysis for the surface textures and vibration patterns A and D.
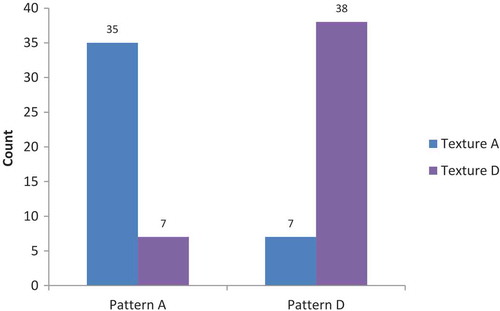
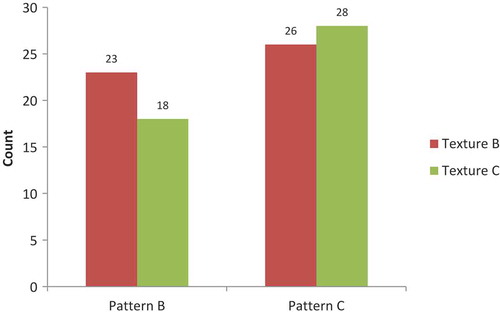
Figure 8. Histogram of the follow-up analysis for the surface textures and vibration patterns B and C.