Figures & data
Figure 1. (a) Mortar head joint shear cracking, (b) diagonal shear cracking through brick, (c) sliding cracking and (d) flexural cracking.
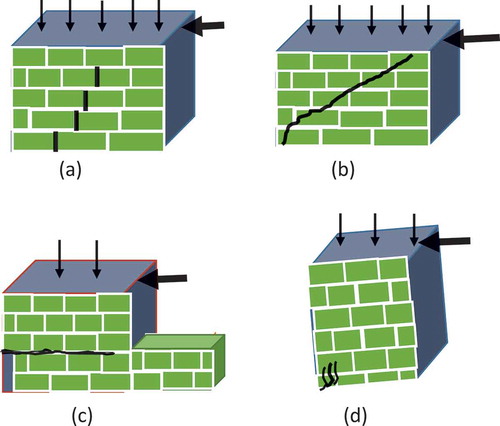
Figure 2. (a) Actual masonry sample. (b) Simplified micro modelling strategy.
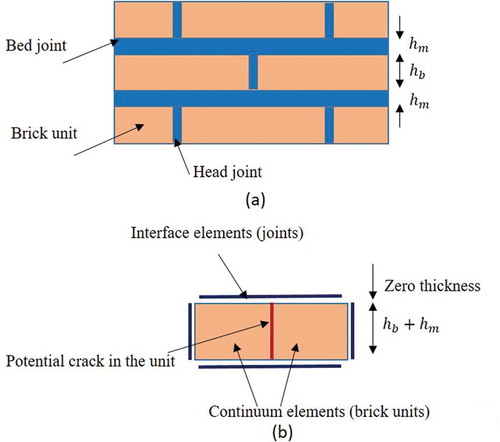
Figure 3. (a) Masonry brick and joint sample. (b) Simplified micro model.
Table 1. Numerical Model properties (Wall—Brick 14MPa, Mortar 7MPa)
Figure 4. (a) Element CQ16M—DIANA®; (b) Interface element CL12I—DIANA®.
Figure 5. Details of wall used for numerical model.
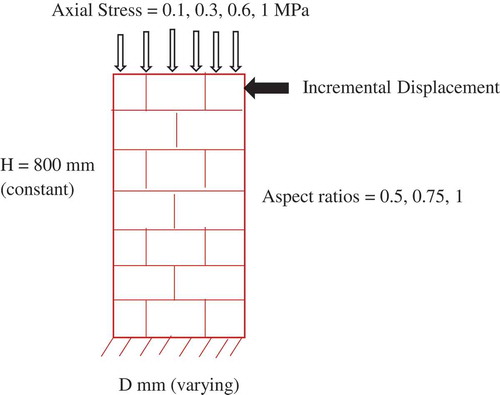
Table 2. Failure Modes (Brick Strength 14 MPa, Mortar Strength 7 MPa)
Figure 6. Monotonic load response (Load-Displacement) for the wall with Height/Length ratio (0.5, 0.75 and 1) and axial stress levels.
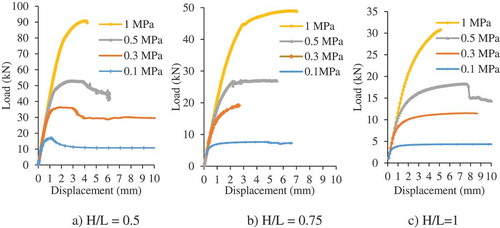
Figure 7. Failure modes of soft brick URM wall.
Figure 8. Effect of axial stress on lateral load capacity of soft brick URM wall.
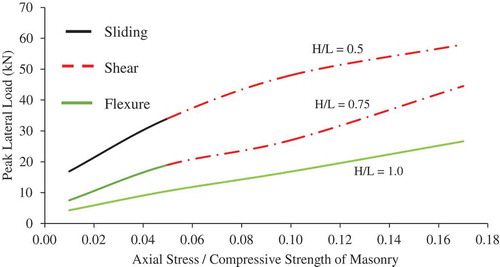
Figure 9. Effect of aspect ratio on lateral load capacity of soft brick URM wall.
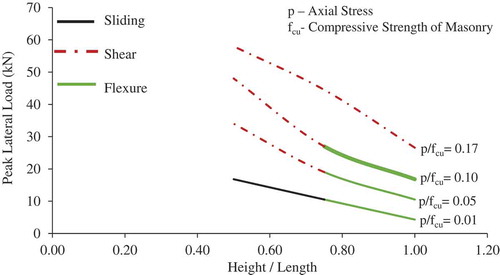
Figure 10. Load response for shear failure through head joint (Brick strength 14 MPa, Mortar strength 7 MPa, Aspect ratio 0.75, and Axial stress 0.5 MPa).
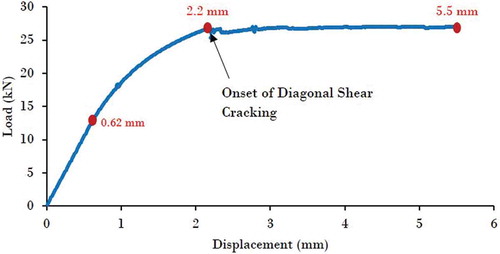
Figure 11. Stages of shear diagonal stepped cracking for shear load response of Figure .
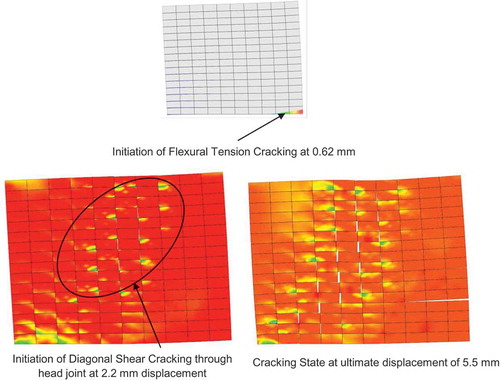
Figure 12. Load response of wall failing in sliding (Brick Strength 14 MPa, Mortar strength 7 MPa, Aspect ratio 0.5, Axial stress 0.1 MPa).
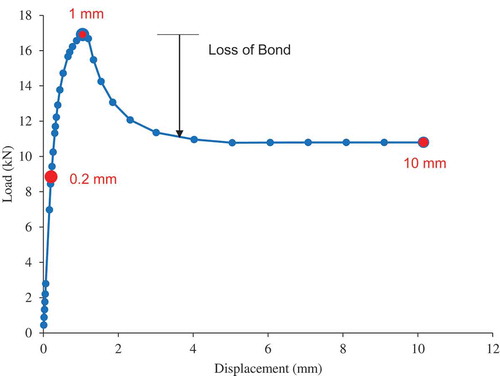
Figure 13. Stages of sliding failure mode for load response of Figure .
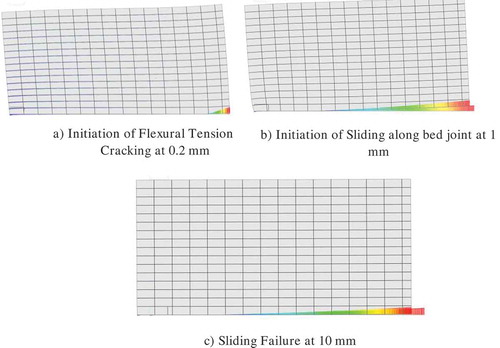
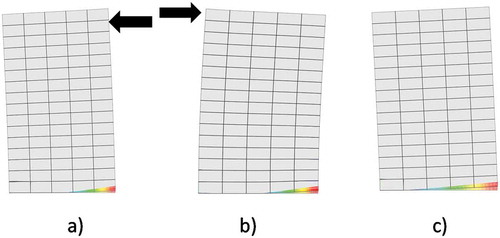
Figure 14. Load response of wall failing in flexure rocking (Brick strength 14 MPa, Mortar strength 7 MPa, Aspect ratio 1.0, Axial stress 0.3 MPa).
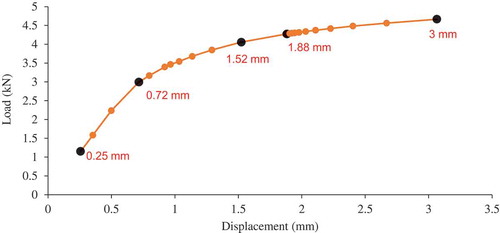
Figure 15. Compressive stress distribution for load response of Figure (Red Zone denotes Tension Region) at 0.25 mm, 0.72 mm, 1.52 mm, 1.8 mm and 3 mm, respectively.
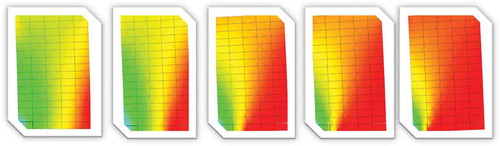
Figure 16. Distribution of compressive stresses along base of wall (for Flexural Load Response).
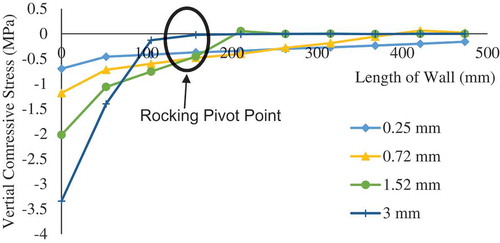
Figure 17. Shift of resultant along base of wall for flexural load response.
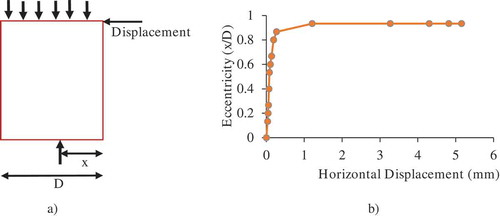
Figure 18. (a) Wall details (b) Wall mesh in DIANA®.
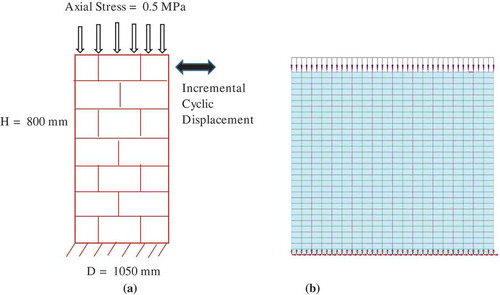
Figure 19. Cyclic load response for shear failure.
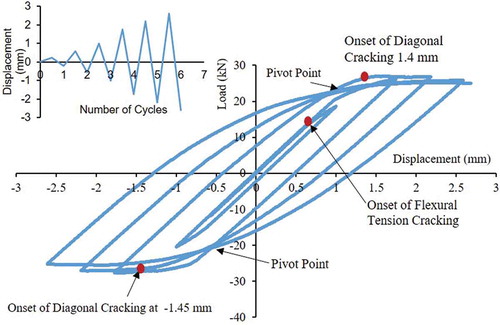
Table 3. Measured strengths
Figure 20. (a) Onset of flexure tension cracking at 0.7 mm; (b) onset of diagonal stepped cracking through joint at −1.4 mm (fourth cycle); (c) formation of new diagonal cracks due to load reversal and (d) diagonal stepped cracking through joint at 2.6 mm.
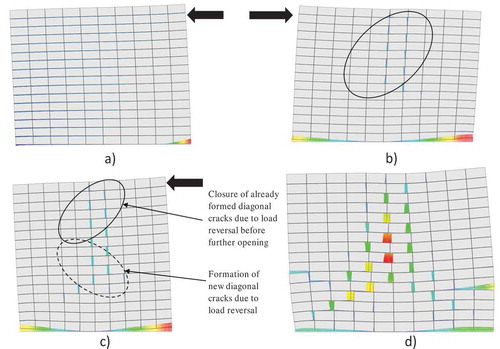
Figure 21. (a) Wall details (b) Wall mesh in DIANA®.
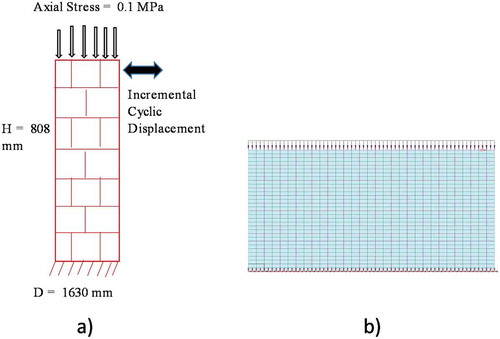
Figure 22. Output cyclic load response for bed-joint sliding failure.
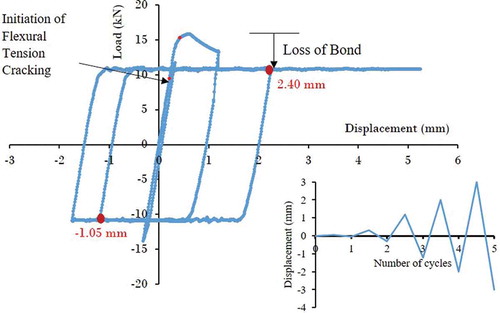
Table 4. Measured strengths
Table 5. Measured strengths
Figure 23. (a) Onset of flexure tension cracking at 0.2 mm (third cycle); (b) onset of bed-joint sliding at 0.45 mm (fourth cycle); (c) contour plot showing sliding at −1.05 mm (fourth cycle); (d) contour plot showing sliding at 2.40 mm (fifth cycle) and (e) bed-joint sliding at 5 mm (last point).
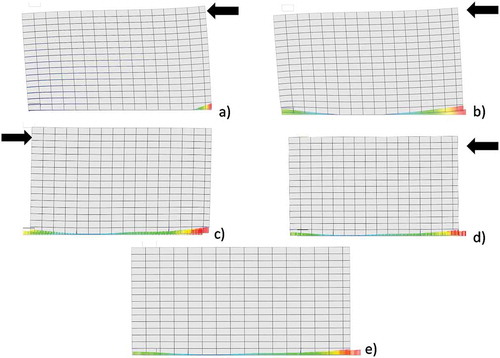
Figure 24. (a) Wall details. (b) Wall mesh in DIANA®.
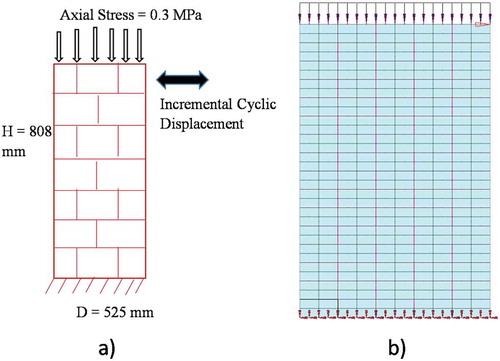
Figure 25. Output cyclic load response – flexural failure.
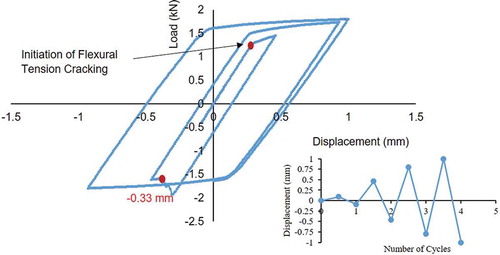
Figure 26. (a) Onset of flexure tension cracking at 0.27 mm (second cycle); (b) contour plot at −0.33 mm (third cycle) and (c) flexural rocking at 1 mm (fourth cycle).