Figures & data
Figure 1. The molecular structure of Congo red (a) and methylene blue (b)
Figure 2. SEM of natural graphite (a) and expanded graphite (b–d)
Figure 3. XRD spectra of graphite and expanded graphite. The shift of (0 0 2) peak was observed in the inset image
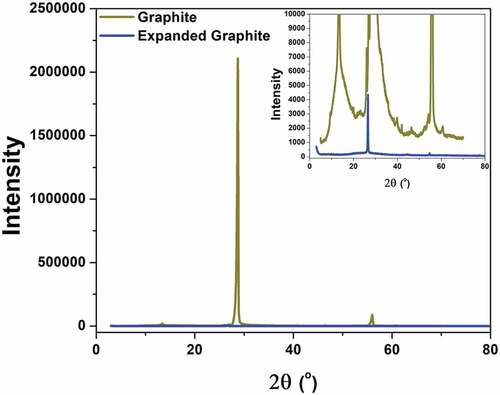
Table 1. Pore parameters of the graphite-based adsorbents
Figure 4. The N2 adsorption/desorption isotherm curves of graphite and expanded graphite
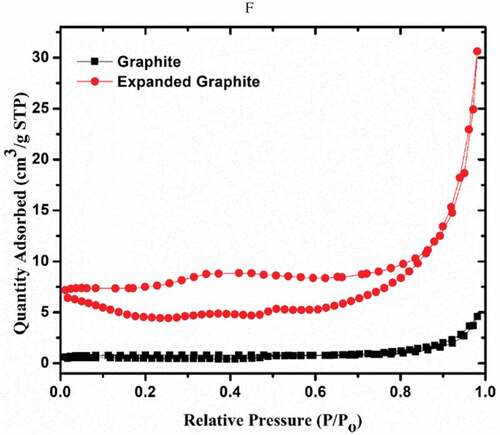
Figure 5. The adsorption capacities of expanded graphite for cationic and anionic dyes
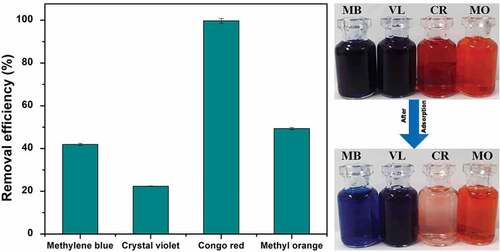
Figure 6. The effect of the contact time for EG with the adsorption capacity (a) and the removed efficiency (b)
Figure 7. Effect of pH in the aqueous solution for EG with the adsorption capacity (a) and the removed efficiency (b)
Figure 8. The effect of amount of adsorbent of EG with the adsorption capacity (a) and the removed efficiency (b)
Figure 9. Effect of the initial concentration of Congo red and methylene blue on EG’s adsorption capacity (a) and removed efficiency (b)
Table 2. Langmuir and Freundlich isotherm model constants for adsorption of CO and MB
Figure 10. Freundlich (a,b) model and Langmuir (c,d) and of the dye adsorption onto EG with Congo red and methylene blue
Figure 11. FT-IR analysis of EG with and without adsorption of Congo red and methylene blue
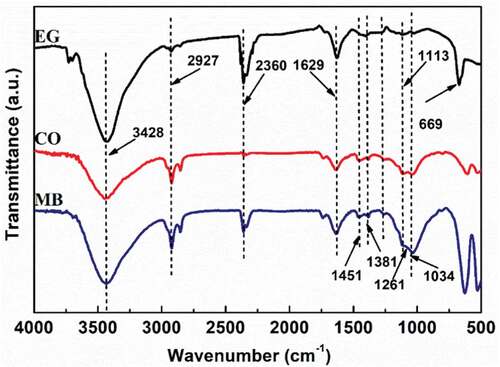
Figure 12. SEM–EDAX mapping of expanded graphite before (a) and after adsorption for Congo red (b) and methylene blue (c)
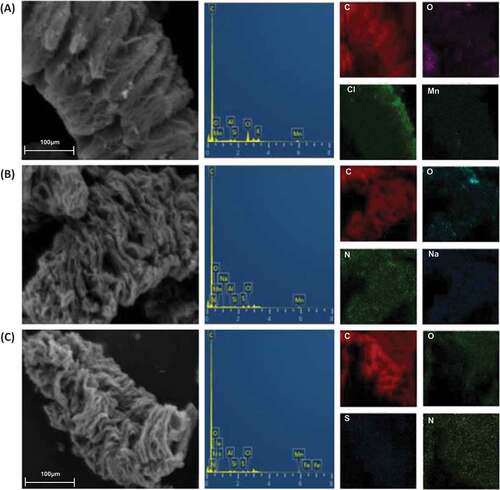
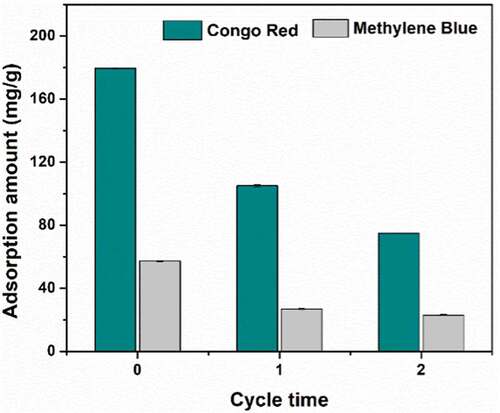
Figure 13. Regeneration data of the expanded graphite in removal of Congo red and methylene blue