Figures & data
Figure 1. Moisture content distribution inside an unpaved road, considering the application of a chemical stabilization method. Stress-chains are developed within the improved soil
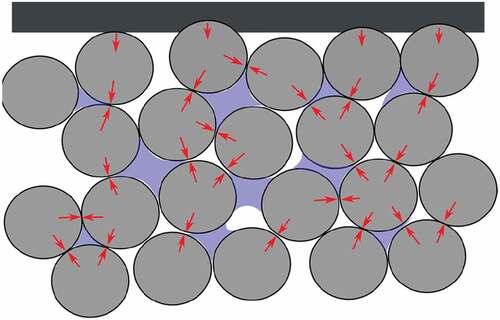
Table 1. Summary of characterization and laboratory results for all studied soils, before the application of the chemical stabilization method
Figure 2. Examples of chemically stabilized soil testing during this research, for any type of soil-stabilizer combination. In (a) Soil failure process during an Unconfined Compressive Strength (UCS) test. (b) Failure after performing a CBR test
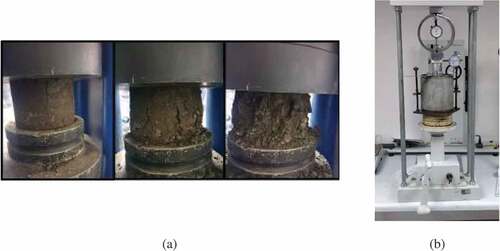
Figure 3. Example of the requirement of grain size distribution of soil, according to Chilean norms (Vialidad, Citation2015). Maximal and minimal distributions are defined in terms of the location of the project, in order to ensure a bearing capacity taking into account the existents materials
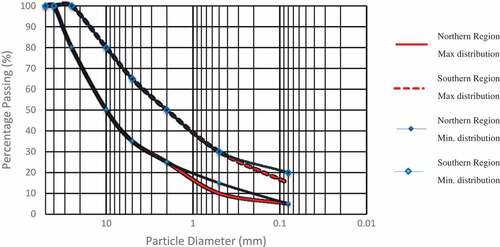
Table 2. Dataset for laboratory tests for all studied soil-additive combination cases
Table 3. Summary of characterization and laboratory results of soils after the application of the chemical stabilization method, including asphaltic, enzymatic and polymeric additives and its bearing capacity improvement respect of the initial case. The fields without variation means that tests were not conducted in those cases
Figure 4. Best improvement for each soil-additive case after the chemical stabilization, presented in terms of the Normalized CBR value. Results are grouped in terms of the fine content percentage
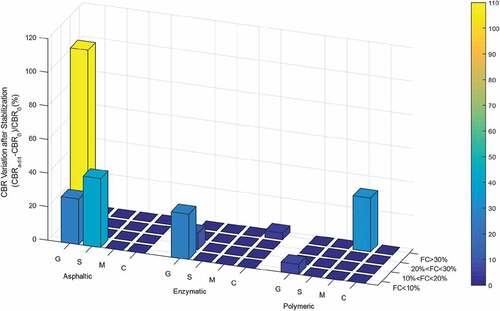
Figure 5. Assessment of Soil Strength variation with CBR and UCS tests in terms of the soil fines content, after the chemical stabilization. At left, samples with asphaltic additive. At center, samples with enzymatic additive. At right, samples with polymeric additive
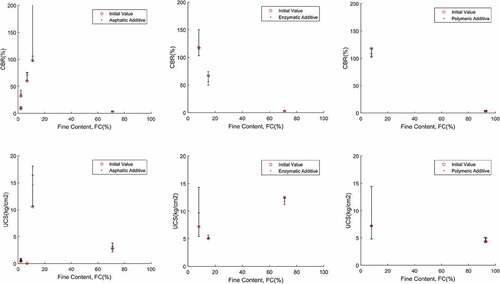
Figure 6. Best improvement for each soil-additive case after the chemical stabilization, presented in terms of the Normalized CBR value. Results are grouped in terms of the Plasticity Index
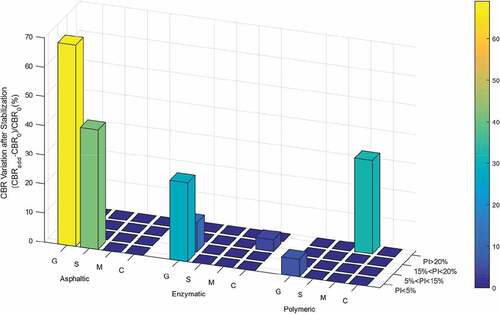
Figure 7. Assessment of Soil Strength variation with CBR and UCS tests in terms of the plasticity index, after the chemical stabilization. At left, samples with asphaltic additive. At center, samples with enzymatic additive. At right, samples with polymeric additive
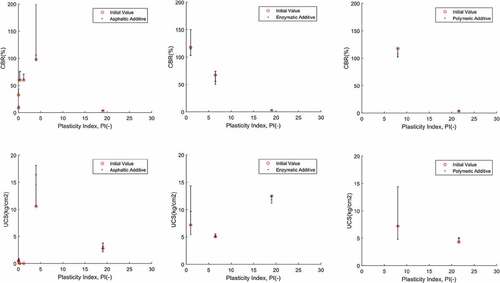
Figure 8. Best improvement for each soil-additive case after the chemical stabilization, presented in terms of the Normalized CBR value. Results are grouped in terms of the moisture content percentage
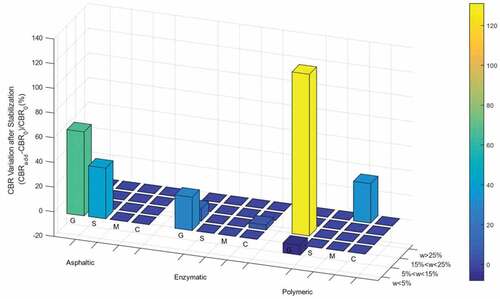
Figure 9. Assessment of Soil Strength variation with CBR and UCS tests in terms of the soil moisture content, after the chemical stabilization. At left, samples with asphaltic additive. At center, samples with enzymatic additive. At right, samples with polymeric additive
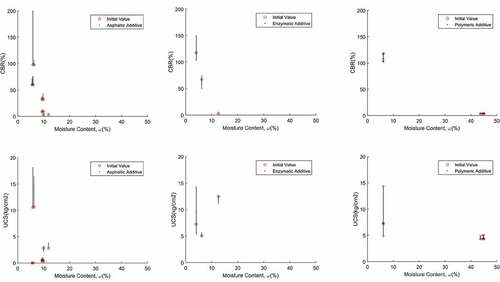
Figure 10. Best results by the application of the additive to main soil distribution compared to the proposal of US-Army (US Army, Citation1997), where additive for granular material at left is asphaltic and for cohesive material is concrete
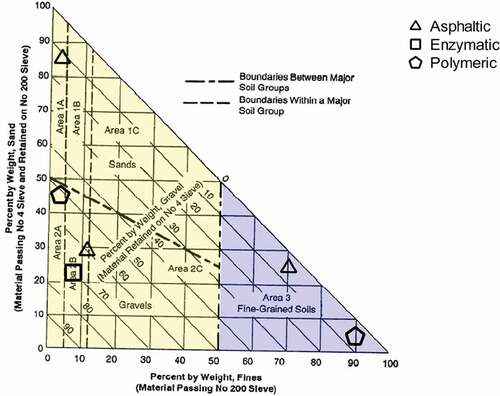
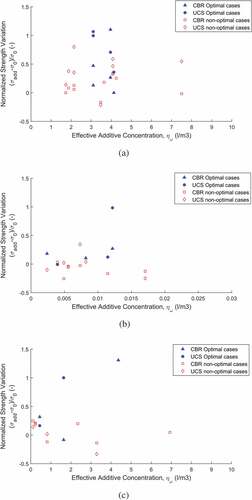
Figure 11. Equivalent moisture content for the studied chemical stabilizers applied to different soils. Filled symbols show all optimal soil strength increase obtained for all test using the stabilizer, while non-filled symbols are non-optimal strength improvements (a) Asphaltic additive (b) Enzymatic additive (c) Polymeric additive