
Figures & data
Figure 1. Cameron highlands watershed, Malaysia
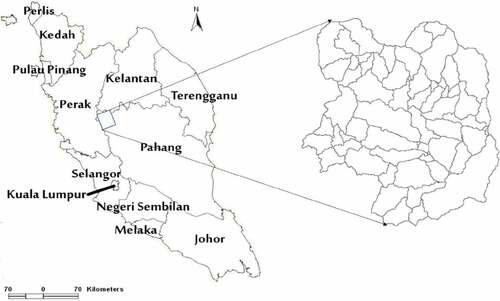
Figure 2. Soil loss map and erosion maps CFs (a) Soil loss map (b) Drainage density map (c) Lineament density map (d) NDVI map (e) LST map (f) SMI map (g) Rainfall erosivity factor (h) LS-factor (i) Erodibility factor (j) Land-use composition
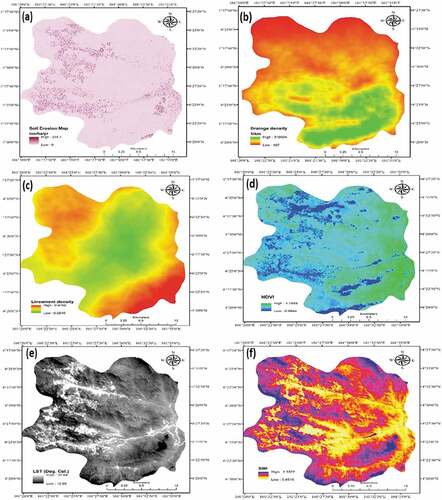
Figure 2. (Continued)
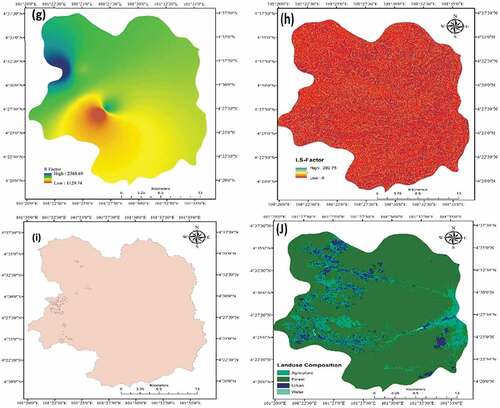
Table 1. Descriptive statistic of Cameron Highlands watershed
Table 2. Summary of the model
Figure 3. Residual plots of standardized residuals against predicted values
Table 3. Analysis of variance (ANOVA)
Table 4. Model parameters for each block
Table 5. Pearson correlation matrix for the selected erosion CFs