Figures & data
Table 1. source of variance and degree of freedom
Table 2. Information on ANOVA
Table 3. Conditions for interpreting the correlation coefficient (R) (Oyetunji & Barnabas, Citation2012)
Figure 1. Flow chart of the work approach
Table 4. Chemical composition of the produced alloys (wt. %)
Table 5. Orthogonal array for the samples
Plate 1: Optical Micrographs of samples: (a) CADI without Sb showing blocky carbide, graphite and ausferrite; (b) CADI with 0.096 wt.% Sb showing less blocky carbide, graphite and ausferrite; (c) CADI with 0.192 wt.% Sb showing granular carbide, graphite and ausferrite; (d) CADI with 0.288 wt.% Sb showing more granular carbide, graphite and ausferrite; (e) CADI with 0.384 wt.% Sb showing granular carbide, graphite and ausferrite; and (f) CADI with 0.48 wt.% Sb showing cellulose carbide, graphite and ausferrite
Table 6. Signal-to-noise-ratio
Table 7.: Taguchi analysis: hardness values versus austempering temperature, austempering time, and antimony content. Response table for signal-to-noise ratios larger is better
Table 8. Taguchi analysis: impact toughness versus austempering temperature, austempering time, and antimony content. Response table for signal-to-noise ratios, larger is better
Table 9. Taguchi analysis: wear resistance versus austempering temperature, austempering time, and antimony content. Response table for signal-to-noise ratios, larger is better
Table 10. Factors of CADI production information
Table 11. Analysis of variance for response
Table 12. Model summary for transformed response
Table 13. General linear model: wear resistance versus austempering time, antimony content. Method factor information
Table 14. Analysis of variance for response
Table 15. General linear model: Hardness versus austempering time, antimony content. Factor information
Table 16. Analysis of variance for transformed response
Table 17. General linear model: Impact toughness values (J) versus austempering time, antimony content. Factor information
Table 18. Analysis of variance for impact toughness value
Table 19. Fits and diagnostics for all observations. Original response
Figure 2. Interaction plot for hardness values (HRc) of the antimony modified CADI
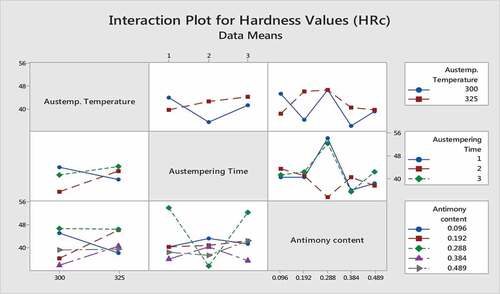
Figure 3. Interaction plot for wear resistance of the antimony modified CADI
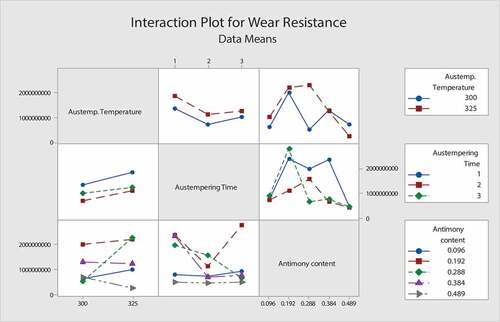
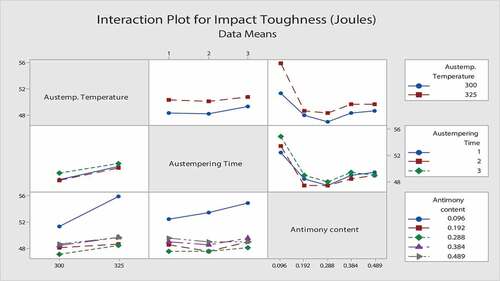
Figure 4. Interaction plot for impact toughness of the antimony modified CADI