
Figures & data
Figure 1. Types of VAWT (Eriksson et al., Citation2008) [4]
![Figure 1. Types of VAWT (Eriksson et al., Citation2008) [4]](/cms/asset/e736a13f-361e-45ec-b6a5-fa620fa987a2/oaen_a_1687073_f0001_b.gif)
Figure 2. Force and velocity vector acting on the cross section of a VAWT blade
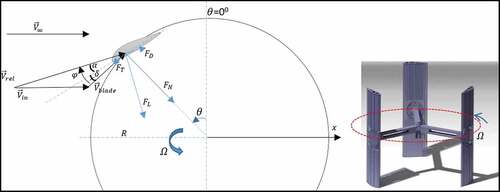
Figure 3. Force and velocity vector acting on the cross section of a HAWT blade, is the tangential direction of the blade
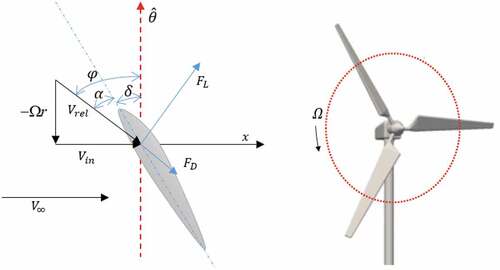
Figure 4. Turbine demonstration using CATIA V5
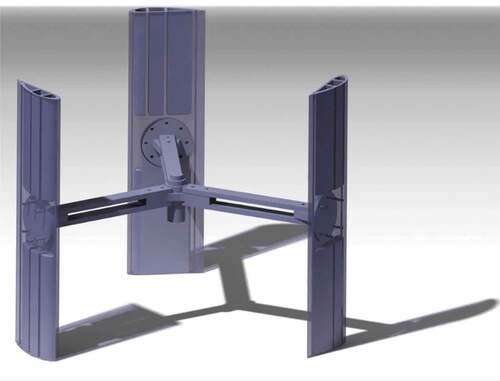
Figure 5. VAWT model demonstration using CATIA V5
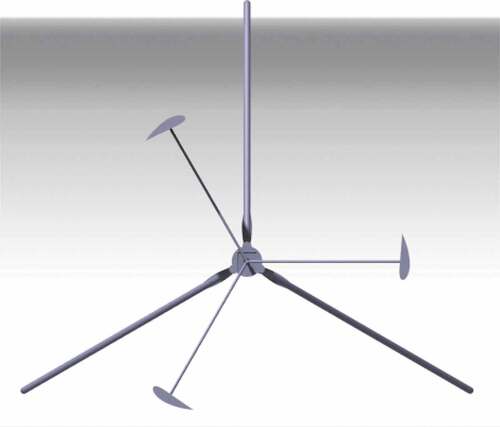
Figure 6. Turbine blade structure of the experiment model
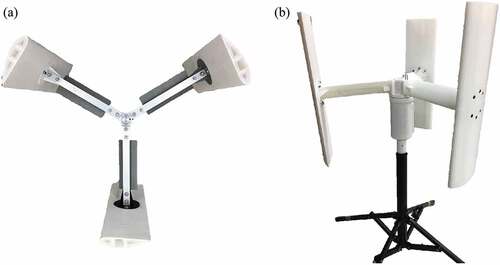
Figure 7. Schematic diagram of the experiment
Figure 8. AoA setting in the horizontal blade of complex airfoil
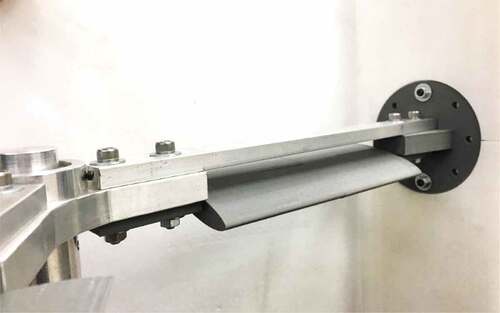
Figure 9. Velocity profile of NACA 6422 in AoA = 0°
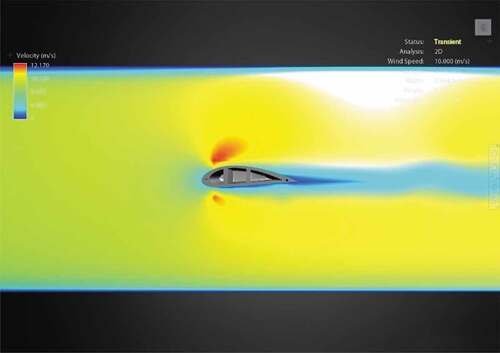
Figure 10. Pressure profile of NACA 6422 in AoA = 0°
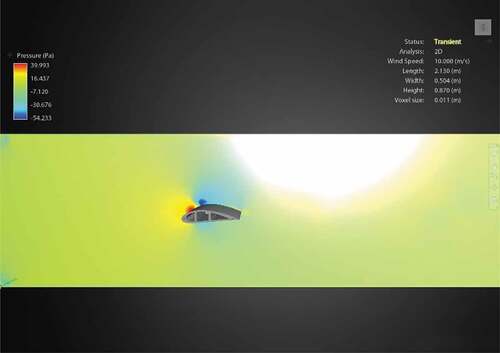
Figure 11. Velocity profile of S833 in A0A = −15°
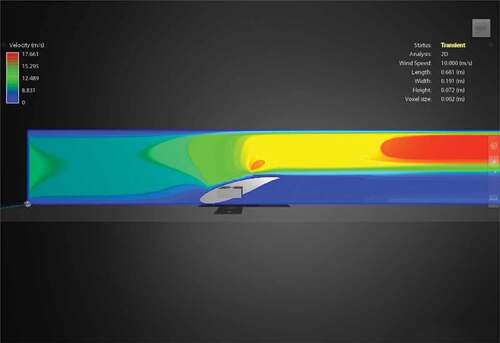
Figure 12. Velocity profile of S833 in AoA = −30°
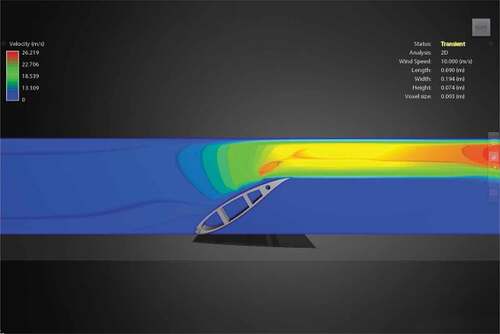
Figure 13. Demonstration of simplified wind tunnel test and real site roof test
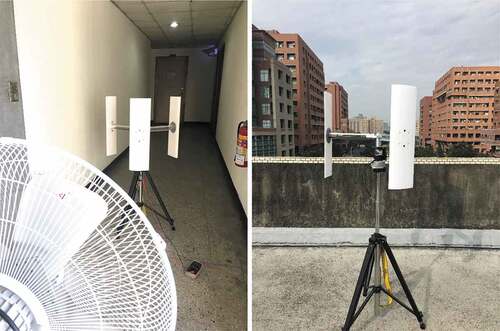
Figure 14. Flowchart of the H-rotor complex airfoil VAWT design
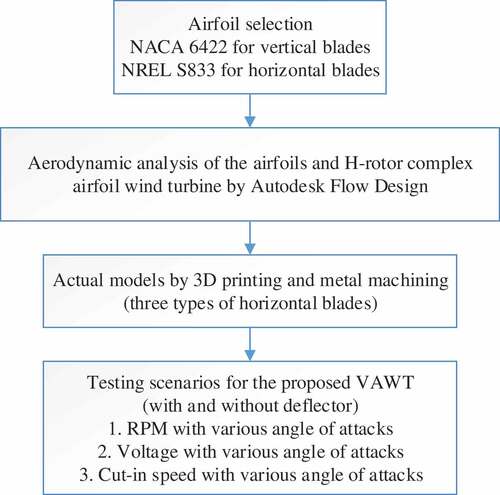
Figure 15. Velocity profile of the complex airfoil VAWT
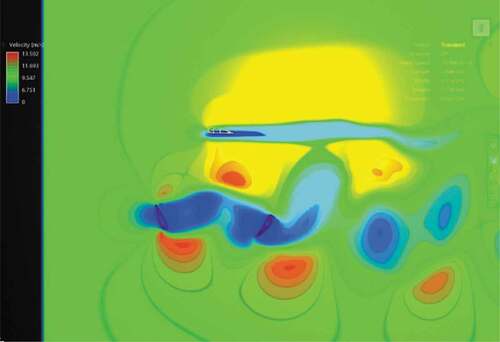
Figure16. Pressure profile of the complex airfoil VAWT
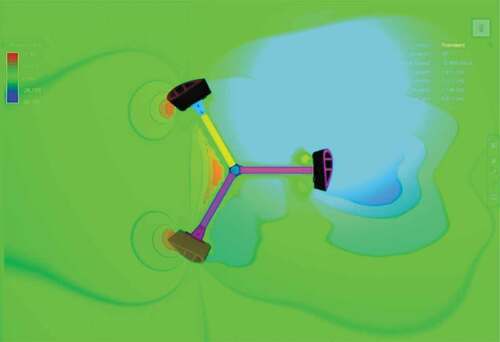
Figure 17. Demonstration of flow line through the complex airfoil VAWT
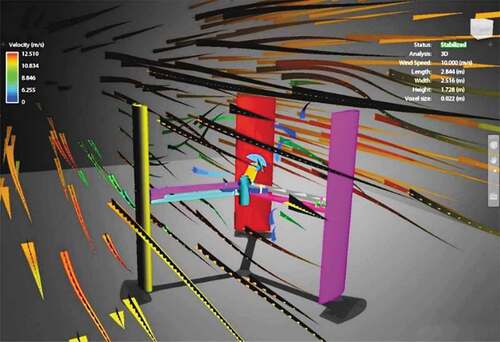
Figure 18. Performance of various AoA with RPM
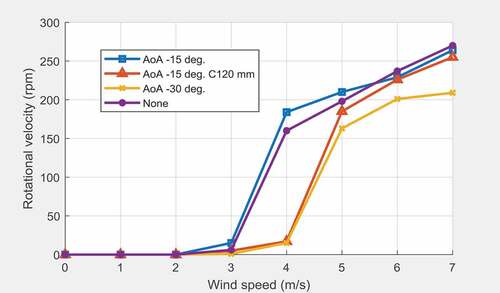
Figure 19. Performance of various AoA with voltage
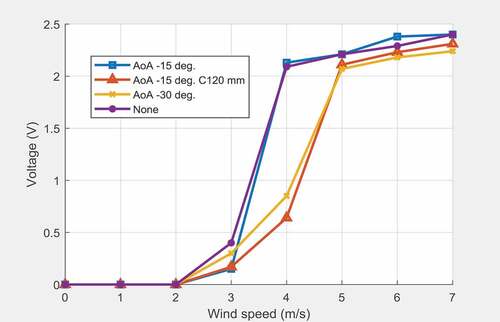
Figure 20. Cut-in speed Comparison
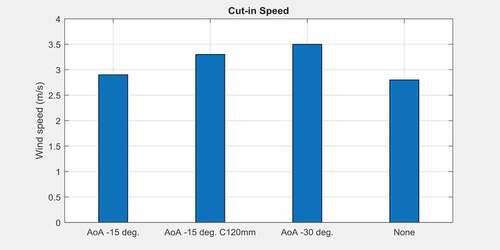
Figure 21. 20 W DC motor for generation
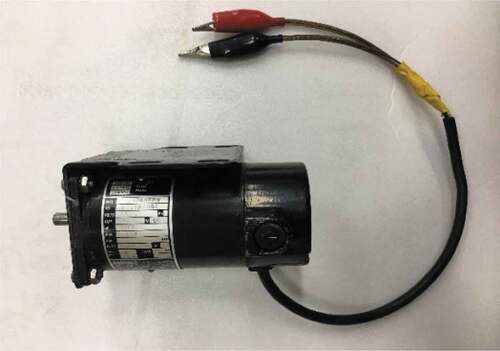
Figure 22. Performance comparison on AoA = −15°
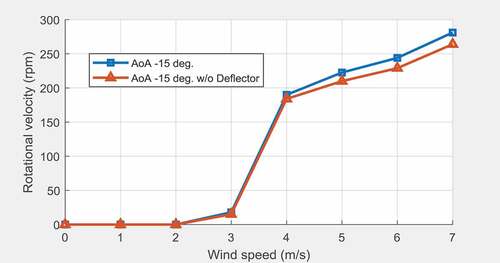
Figure 23. Performance comparison on AoA = −15° and Chord 120 mm
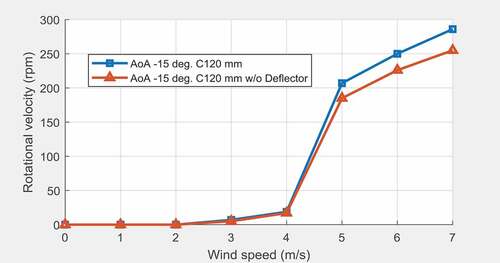
Figure 24. Performance comparison on AoA = −30°
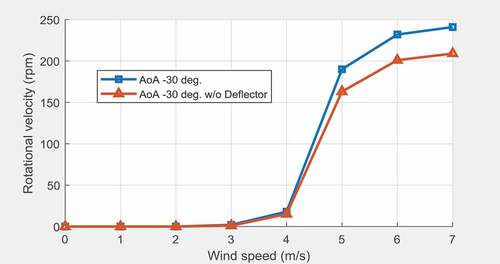
Figure 25. Performance comparison with and without horizontal blades
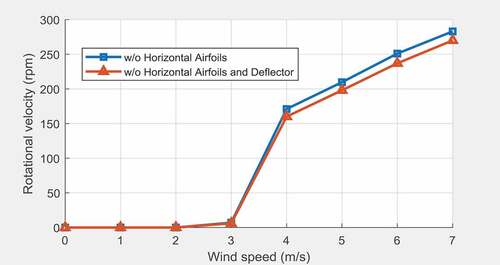
Table 1. AoA and Chord length variable experiment