Figures & data
Figure 1. Graphical explanation of the research methodology
Table 1. Features of sample
Figure 2. Probability indicators: medians of ROS, ROA, ROE observed in 1485 random cases of polish construction companies (2014–2016) by trades
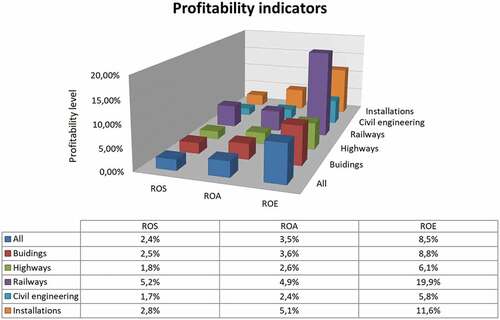
Figure 3. Medians of asset turnover ratio in 1485 random polish construction companies (2014–2016) by trades
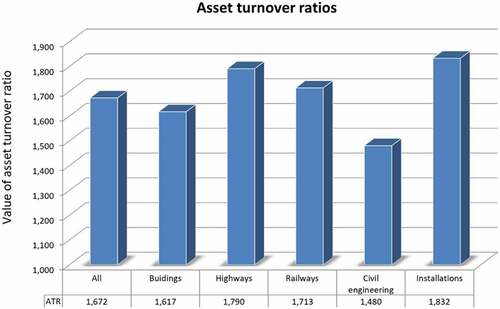
Table 2. Results of finding keywords: “sustainable development” and “circular economy” on websites of top 5 polish companies and their in-built search engines, 2017
Figure 4. Semi-closed loop supply chain for the construction projects and area of occurrence of the finished outcome, e.g. building (green triangle)
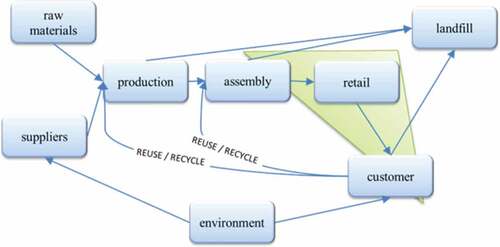
Figure 5. Semi-closed loop supply chain for the conventional model of construction projects and area of occurrence of the collaboration between participants (red circle)
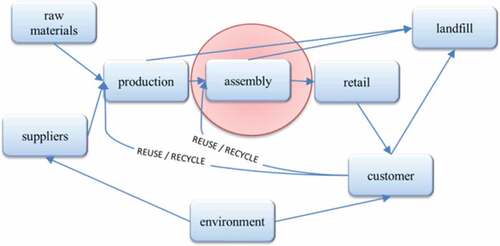
Figure 6. Semi-closed loop supply chain for the real estate development model of construction projects and area of occurrence of the collaboration between participants (red circle)
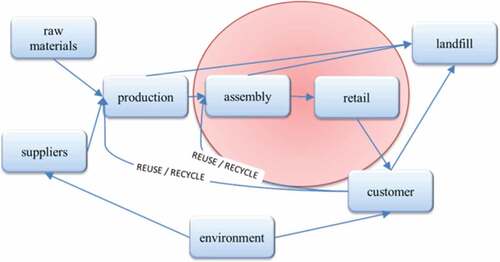
Figure 7. Semi-closed loop integrated supply chain for the construction projects and area of occurrence of the collaboration between participants (red circle)
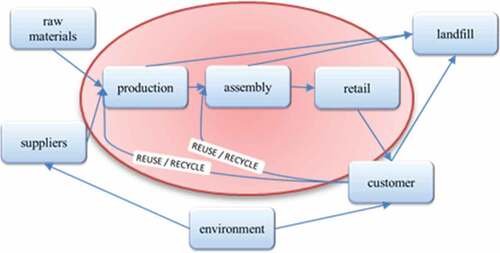
Figure 8. Closed-loop supply chain for construction projects
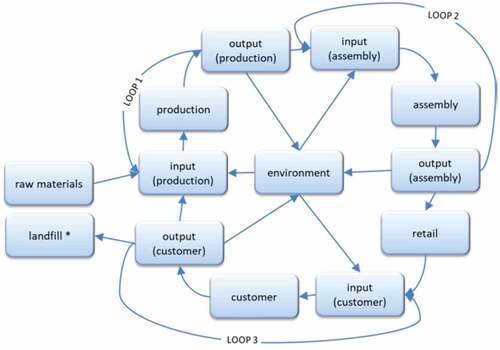
Figure 9. Closed-loop project value chain for value management of construction projects
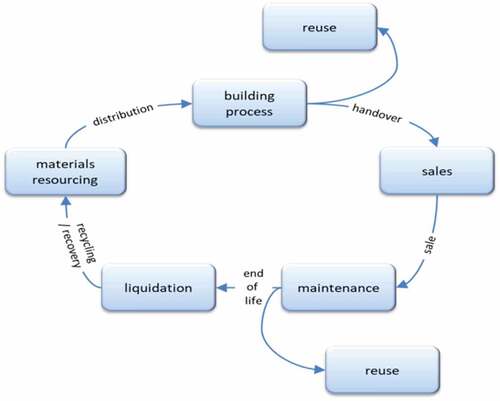
Table 3. Details of computational analysis performed in @Risk (Palisade)
Figure 10. Probability density of the company’s condition as a factor of propensity to implement circular economy in two types of economies: stable (red) and unstable (blue)
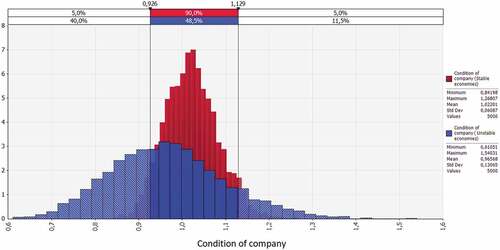
Figure 11. Tornado chart—simulation sensitivities of company’s condition as a factor of propensity to implement circular economy in stable economies
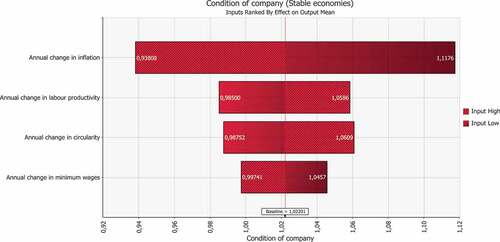
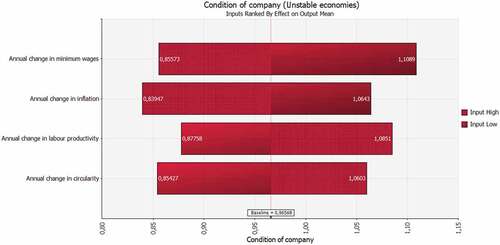
Figure 12. Tornado chart—simulation sensitivities of company’s condition as a factor of propensity to implement circular economy in unstable economies