Figures & data
Figure 1. Ornstein-Uhlenbleck process. (a) Desired PDF (Red) and Controlled PDF (Blue). (b) Control function Lagrange interpolation
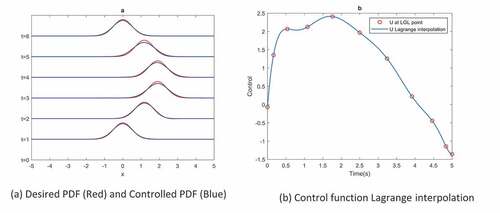
Figure 2. Ornstein-Uhlenbleck process. (a) Mean of the state. (b) Variance of the state under control function
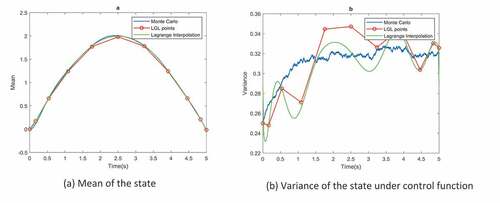
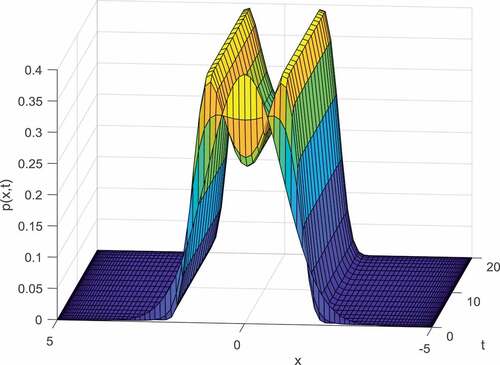
Figure 3. Ornstein-Uhlenbleck process. Time evolution of probability density function of state under control function
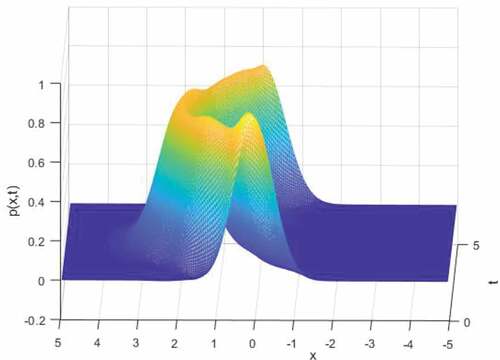
Figure 4. Typical nonlinear system
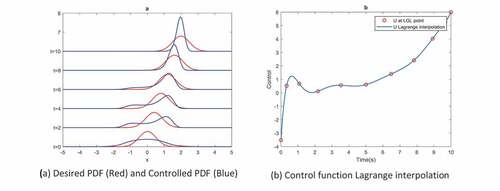
Table 1. Parameters of the simulated stochastic processes
Figure 5. Typical nonlinear system
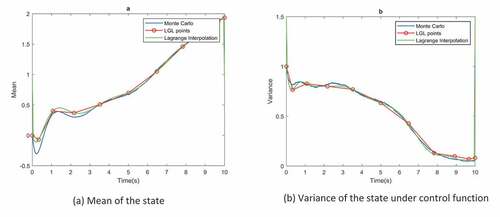
Figure 6. Typical nonlinear system. Time evolution of probability density function of state under control function
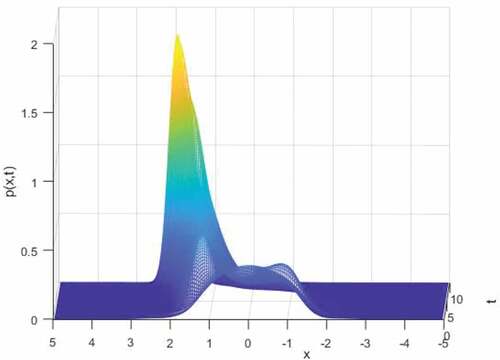
Figure 7. Typical nonlinear system with two stable equilibrium points with initial condition