Figures & data
Table 1. Survey of publications with the “Management in Services” topic and its approaches
Table 2. Survey of publications with the “quality performance measurement service processes education” topic and its approaches
Table 3. Identification of the approaches in the analyzed publications
Figure 1. Phases and steps of the proposed conceptual model
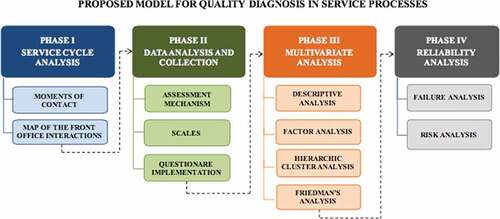
Figure 2. Chart with 22 moments of contact (services; constructs) versus 9 determinants: 1-Access; 2-Speed; 3-Ambience; 4-Competence; 5-Consistency; 6-Flexibility; 7-Reliability; 8-Tangibility; 9-Cost
Figure 3. Chart with scales of the assessment mechanism (a nine-point Likert scale)
Table 4. Analysis of the assessment scales
Table 5. Reliability, convergent validity and dimensionality of constructs (1Extracted Variance—EV; 2Cronbach’s Alfa—CA; 3Composite Reliability—CR; 4Sample Suitable Measure from Kaiser-Meyer-Olkin—KMO; 5Dimensionality)
Table 6. Descriptive analysis of indicators
Table 7. Characterization of groups concerning questions
Table 8. Friedman’s test for analysis of expectation, minimum acceptable and observed
Figure 4. Radar graph for the problem
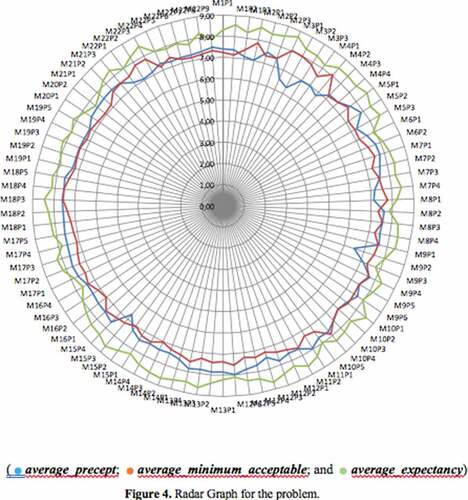
Figure 5. Chart showing the failures ranking for decision making
Figure 6. Summary of the proposed model applied to the analyzed HEI