
Figures & data
Figure 1. Map of Lagos Mega City Showing Industrial and Non Industrial Zone
Source: (Ogungbuyi & Osho, Citation2005).
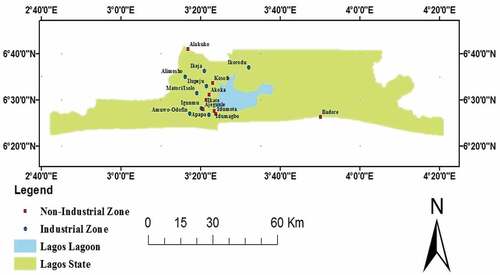
Table 1. Population of People Using Each Domestic Fuel
Table 2. Annual Quantity of Domestic Fuel Consumed in Each Industrial Zone
Figure 2. Chart of Domestic Fuel Consumption
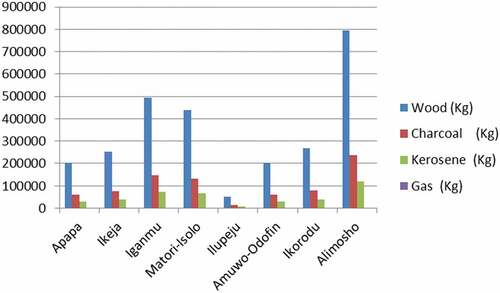
Table 3. Quantity of Emission of all the Industrial Zones
Figure 3. Plot of Industrial Production Capacity
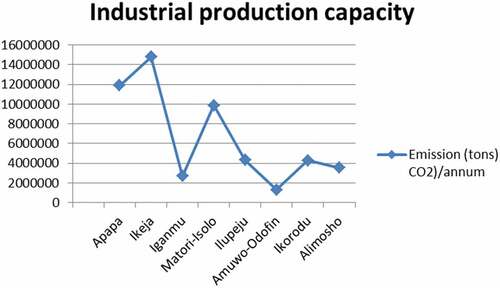
Table 4. CO2 Emissions According to Industrial Averages as at 2015