Figures & data
Figure 1. Wind energy conversion system
Figure 2. Coefficient Cp versus λ
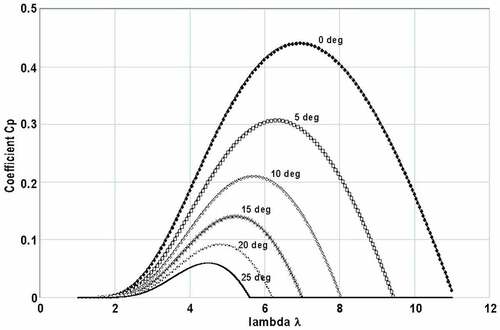
Figure 3. PMSG scheme
Figure 4. Circuits of a PMSG on (d,q) axis
Figure 5. Three-phase diode rectifier
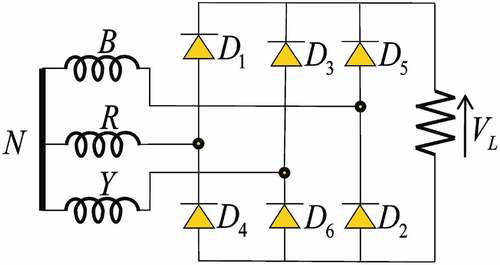
Figure 6. Boost converter
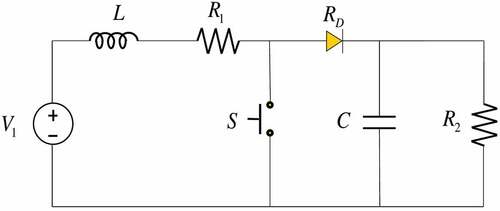
Figure 7. Inverter circuit
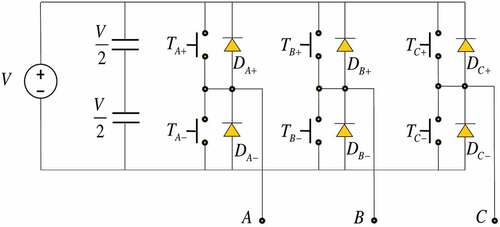
Figure 8. A bond
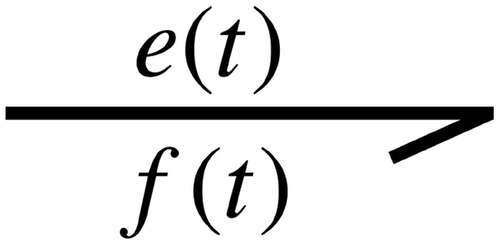
Figure 9. Causal bond
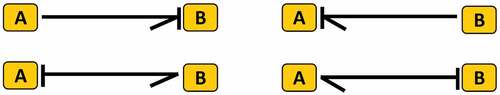
Figure 10. Power sources
Figure 11. Bond with resistance
Figure 12. Bond in integral causality for capacitance and inertance
Figure 13. Bond in derivative causality for capacitance and inertance
Figure 14. Bonds for transformers and gyrators
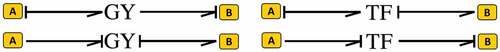
Figure 15. 1 and 0 junctions
Figure 16. Scheme of a bond graph
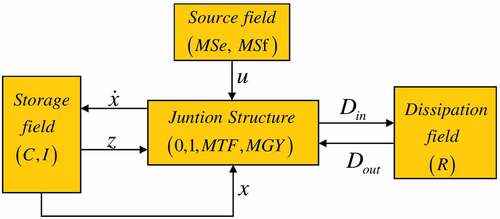
Figure 17. Representation of the bonds; (a) Single bond; (b) Multibond
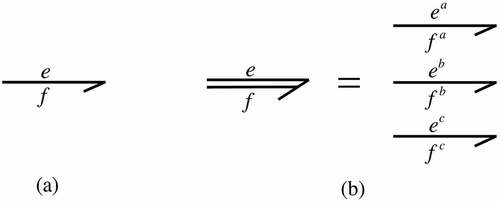
Figure 18. Multibond graph with efforts and flows
Figure 19. Multibond graph elements
Figure 20. Eulerian junction structure
Figure 21. Junction structure and key vectors of a multibond graph
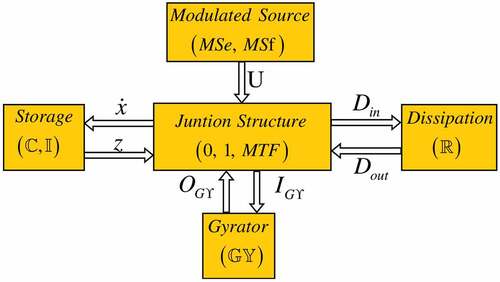
Figure 22. Sections of a blade
Figure 23. Bond graph of a blade
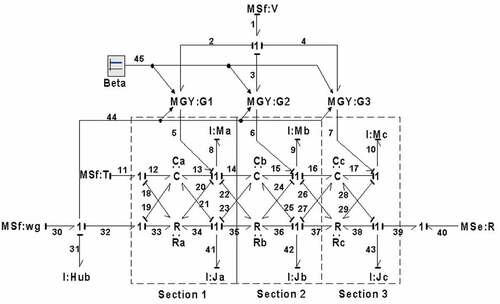
Table 1. Technical specifications (Skystream, Citation2013)
Figure 24. PMSG bond graph
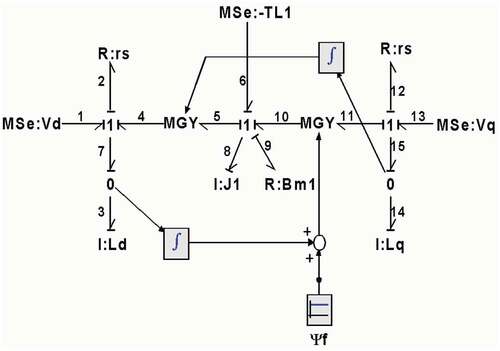
Figure 25. PMSG multibond graph
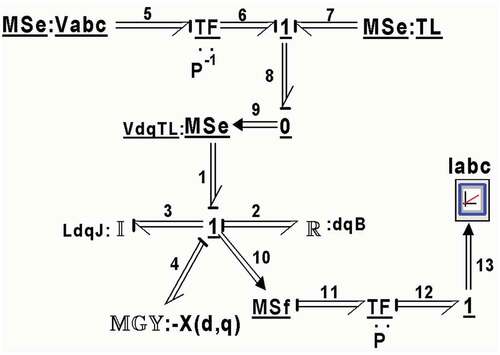
Figure 26. HMBG of the rectifier
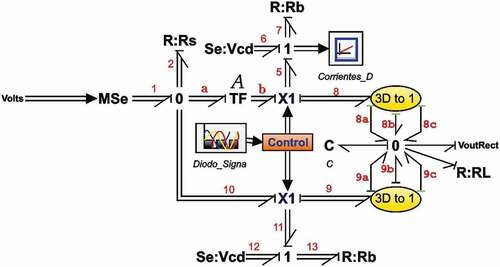
Figure 27. Bond graph model of the boost converter
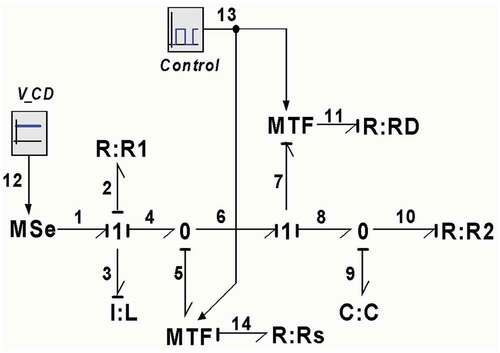
Figure 28. Switching element models
Figure 29. Hybrid multibond graph model of a three-phase five level
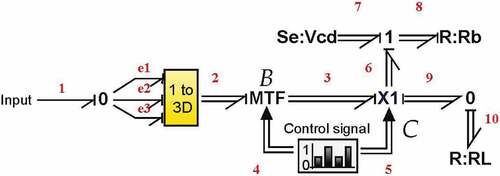
Figure 30. Elements of the Skystream wind turbine
Figure 31. Electrical power of the blades for the Skystream
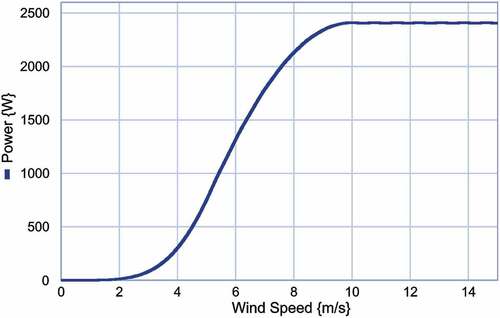
Figure 32. Simulation results of PMSG: (a) Voltages on (d,q) axis; Electrical Currents on (d,q) axis; (c) Velocity and electrical currents on (a,b,c)
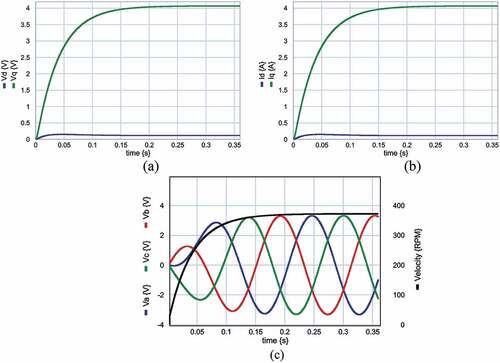
Figure 33. Simulation results of the rectifier
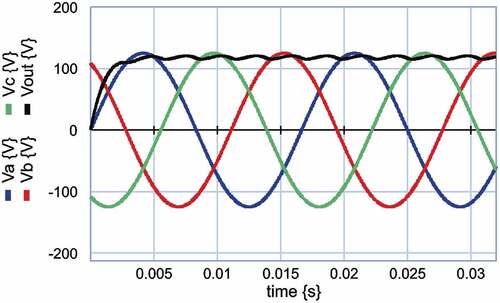
Figure 34. Simulation results of the Boost converter and inverter
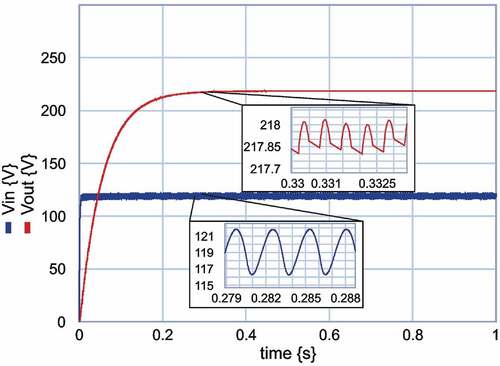
Figure 35. Output voltages of the inverter
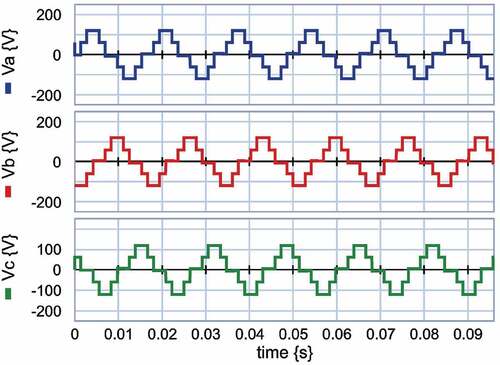
Figure 36. Skystream ubicated at the University of Michoacan
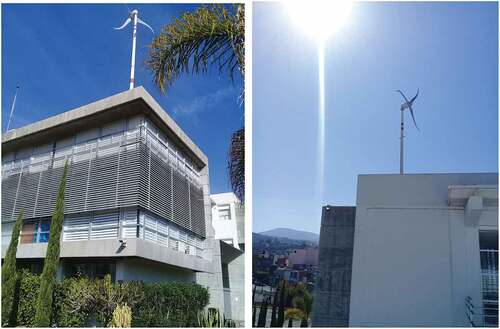
Figure 37. Skystream power from real data and simulation
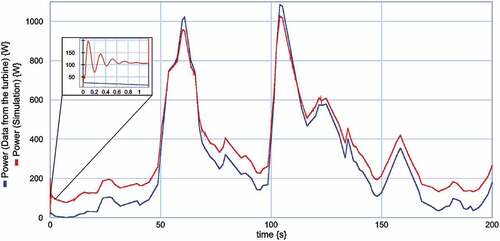
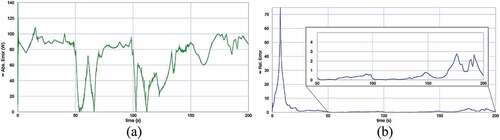
Figure 38. Error analysis: (a) Absolute error; (b) Relative error