Figures & data
Figure 1. Transfer function model of the three-area thermal system with DMPID controller
Figure 2. Structure of the proposed dual-mode PID controller
Figure 3. Nature of movement of ions
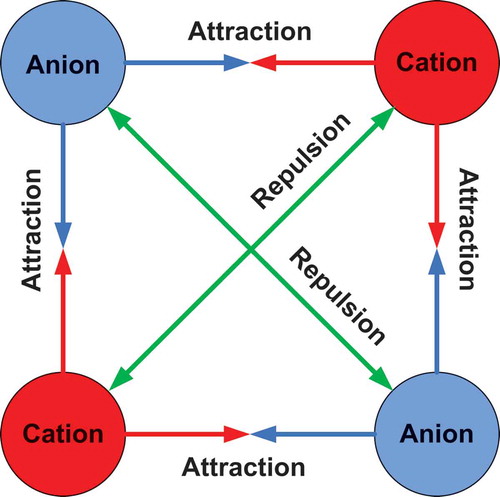
Table 1. Optimal gains of IMO tuned PID and DMPID controllers with application of an SLP of 0.01 p.u. in area 1
Table 2. Performance evaluative factors with different controllers due to a SLP of 0.01 p.u. in area 1
Figure 4. Frequency deviation in area 1 with application of an SLP of 0.01 p.u. in area 1
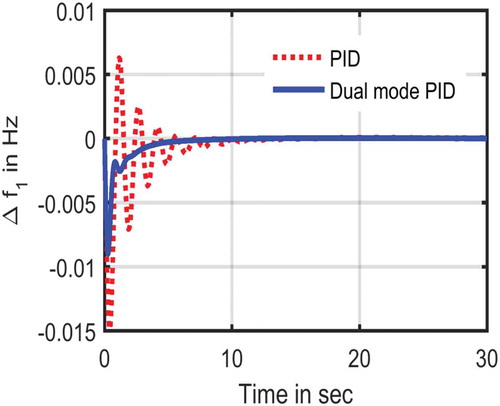
Figure 5. Frequency deviation in area 2 with application of an SLP of 0.01 p.u. in area 1
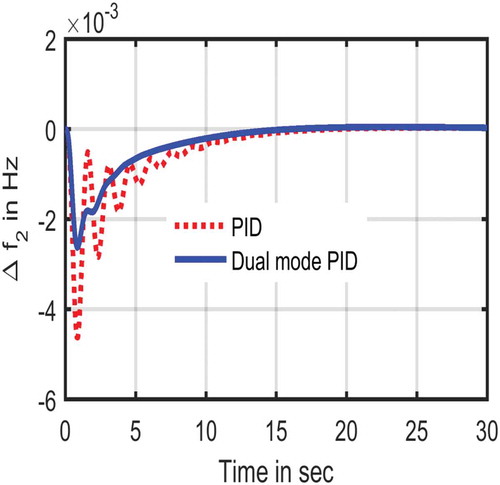
Figure 6. Frequency deviation in area 3 with application of an SLP of 0.01 p.u. in area 1
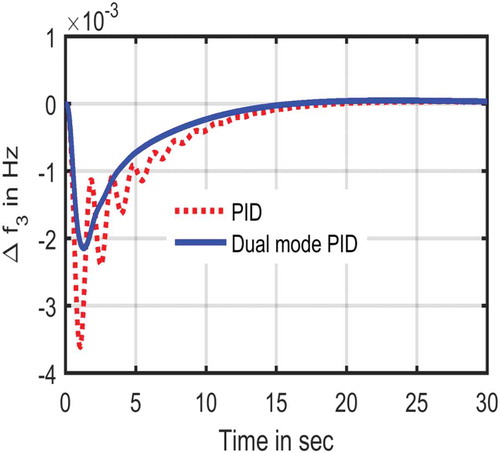
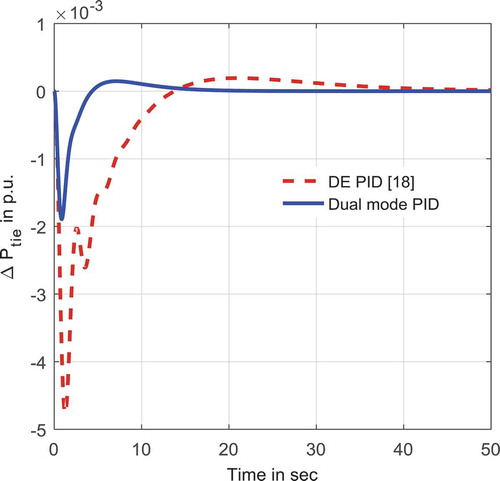
Figure 7. Tie-line power deviation between areas 1 and 3 with application of an SLP of 0.01 p.u. in area 1
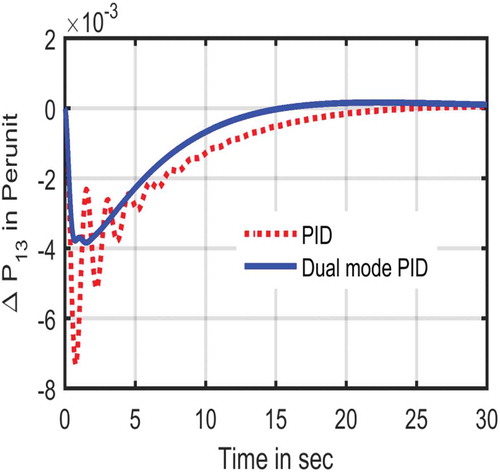
Figure 8. Tie-line power deviation between areas 1 and 2 with application of an SLP of 0.01 p.u. in area 1
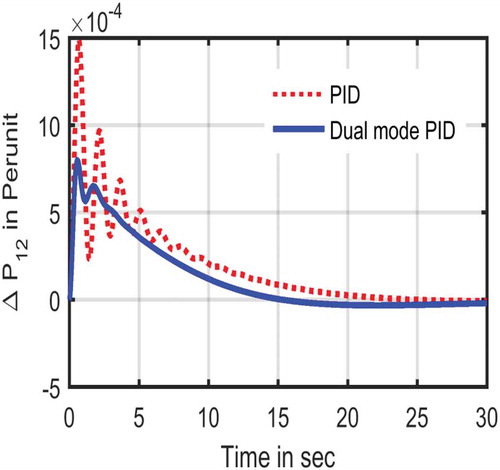
Figure 9. Frequency deviations in area 1 due to an SLP of 0.01 p.u. in all areas simultaneously
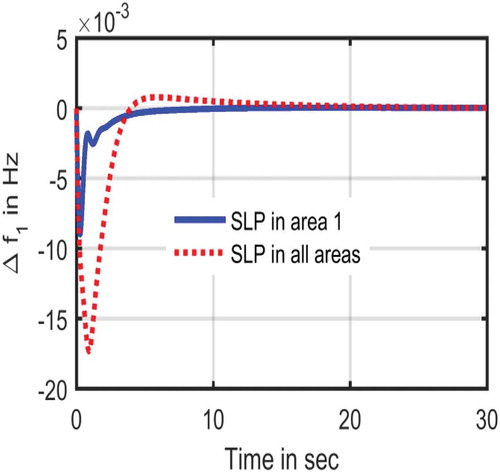
Figure 10. Tie-line power deviations between area 1&3 due to an SLP of 0.01 p.u. in all areas simultaneously
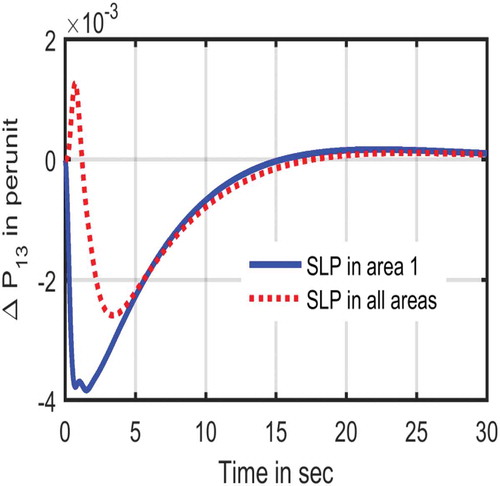
Table 3. Performance evaluative factors ofand
for different loading conditions in area 1
Figure 11. Frequency deviations in area 1 due to parameter variations
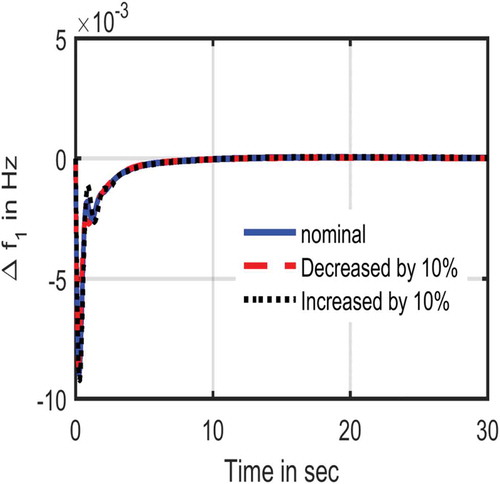
Figure 12. Tie-line power deviation between areas 1 and 3 due to parameter variations
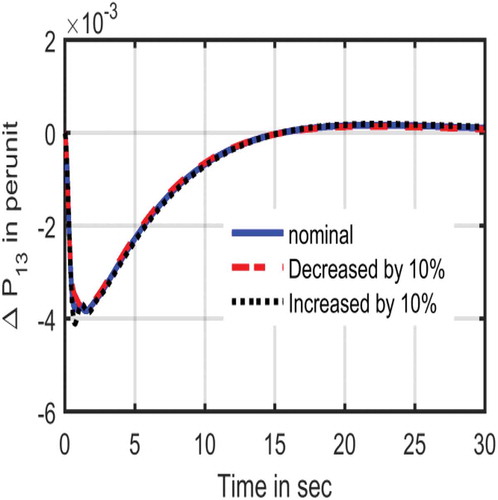
Figure 13. Random loading pattern in area 1
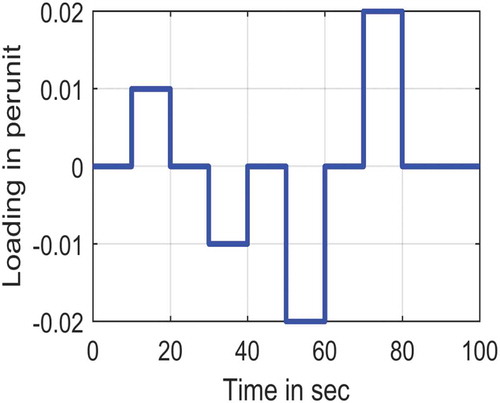
Figure 14. Frequency deviations in area 1 due to random loading in area 1
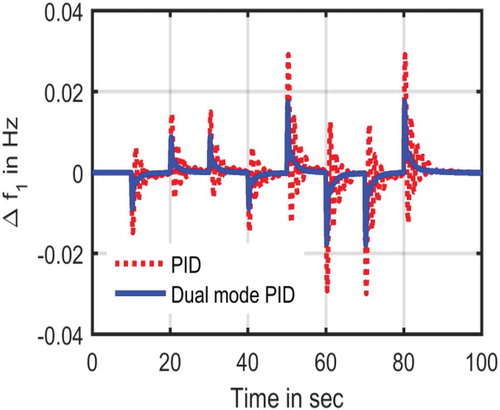
Figure 15. Tie-line power deviation between areas 1 and 3 due to random loading in area 1
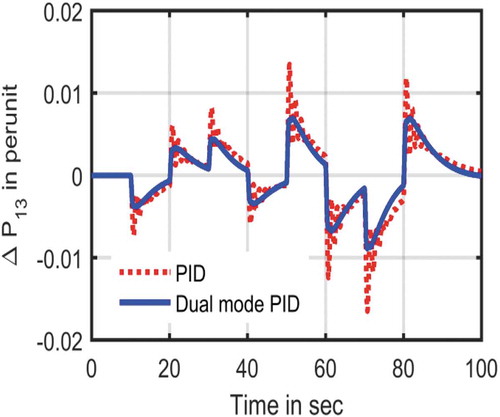
Figure 16. Frequency deviations in area 1 considering time delay
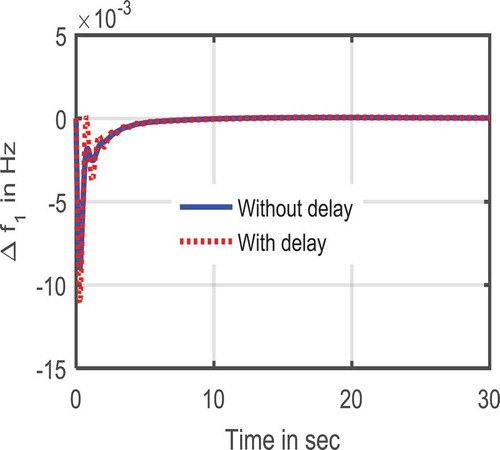
Figure 17. Tie-line power deviation between areas 1 and 3 considering time delay
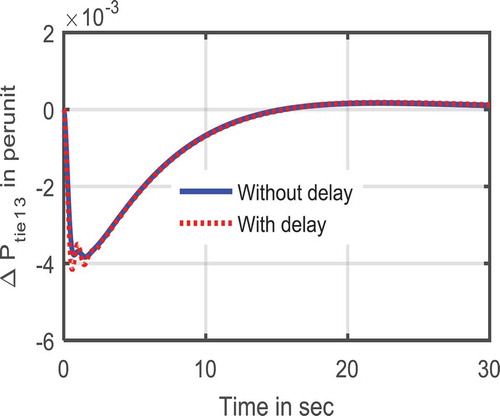
Table 4. Performance indices with a SLP of 0.01 p.u. in area 1
Table 5. Optimum gains of DMPID controllers of multi-source power system tuned by IMO algorithm
Figure 18. Transfer function model of the multi-source power system with PID/DMPID controller
Figure 19. Frequency deviation of area 1 of multi-source system considering 1% SLP in area 1
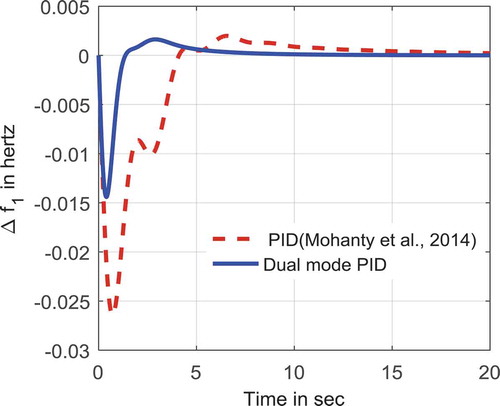
Figure 20. Frequency deviation of area 2 of multi-source system considering 1% SLP in area 1
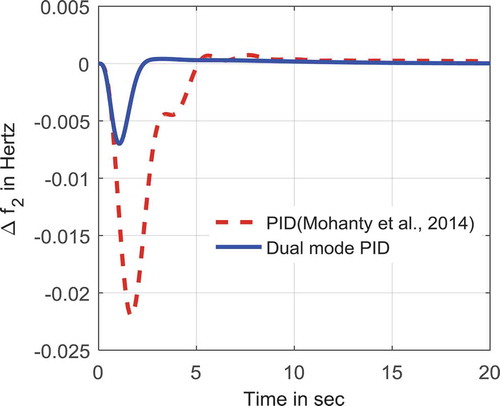
Figure 21. Tie-line power deviation of multi-source system considering 1% SLP in area 1