
Figures & data
Figure 1. Geological map of Nigeria showing the study area (After Obaje, Citation2009)
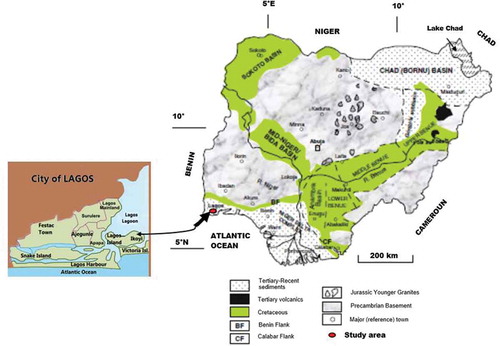
Figure 2. Wenner array for geoelectrical resistivity data measurements (Aizebeokhai & Oyeyemi, Citation2014)
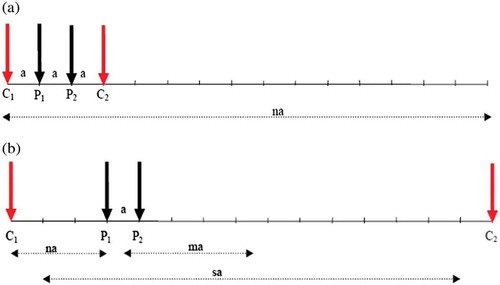
Figure 3. Inverse resistivity model of the 2D ERI line L1
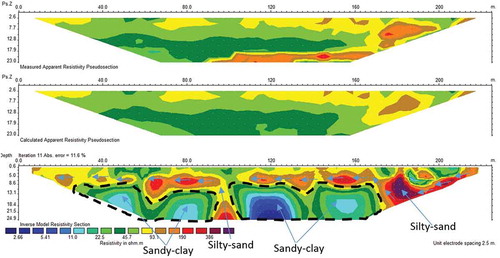
Figure 4. Inverse resistivity model of the 2D ERI line L2
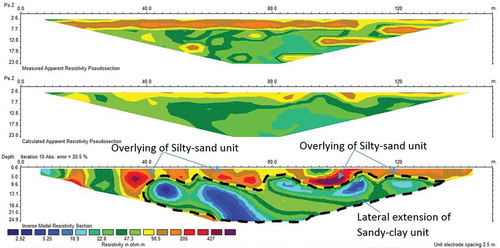
Figure 5. Inverse resistivity model of the 2D ERI line L3
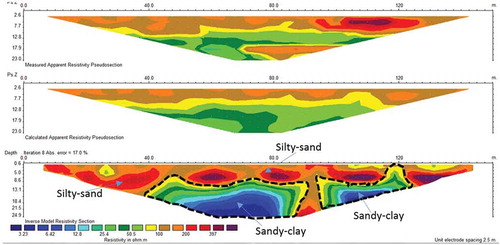
Figure 6. (a) Results of BH1 soil log stratification and description for the study area. (b) Results of BH2 soil log stratification and description for the study area
Figure 7. Estimated average allowable bearing pressures with depth (block A)
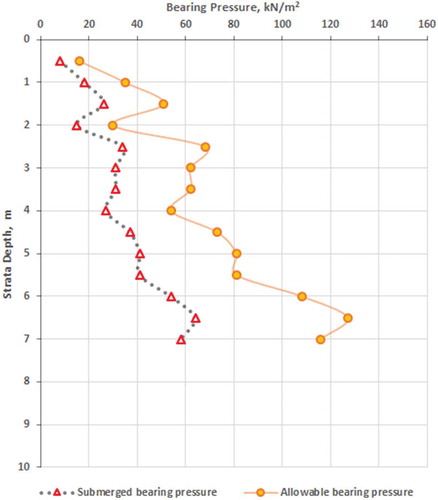
Figure 8. Estimated average allowable bearing pressures with depth (block B)
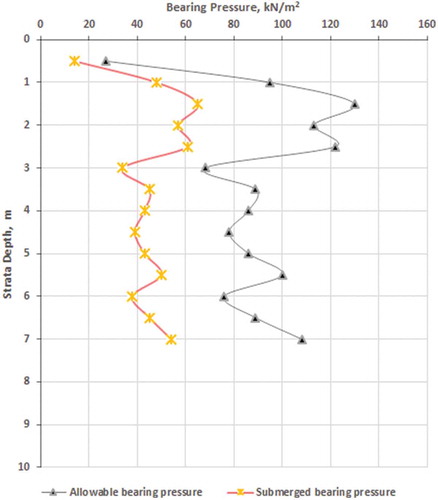
Figure 9. Comparing the estimated average allowable bearing pressures with depth within the two sites of study (blocks A and B)
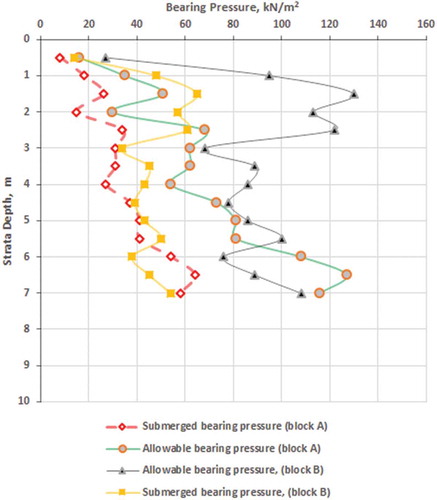
Table 1. Estimated average cone resistance of soil with depth (block A)
Table 2. Estimated average cone resistance of soil with depth (block B)
Table 3. Summary of Particle Size Distribution and Soil Grained Classification
Table 4. Results of Triaxial Tests on selected samples
Table 5. Results of consolidation tests on selected samples