
Figures & data
Figure 1. Distribution of AR values for 13 lithotypes
(Each lithotype is color/number coded).
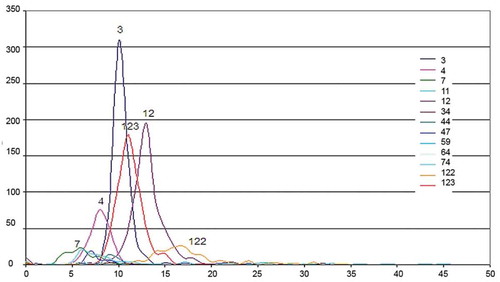
Figure 2. “Measured” and generated AR values
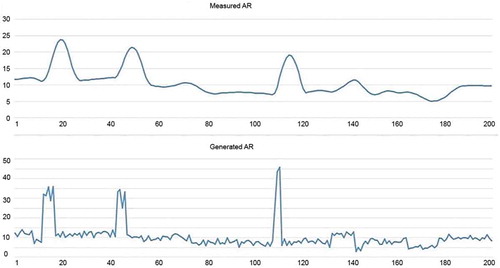
Figure 3. Modeled (left column) and actual (right column) log-data for AR (blue) and SP (green) values
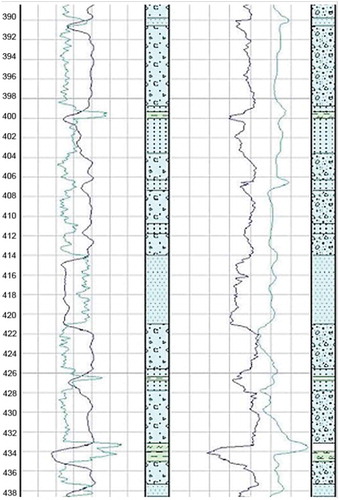
Figure 4. LSTM memory cell (Hochreiter & Schmidhuber, Citation1997)
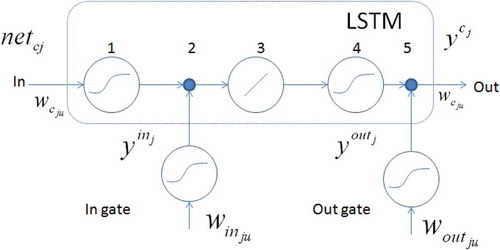
Figure 5. LSTM network architecture implemented in Keras
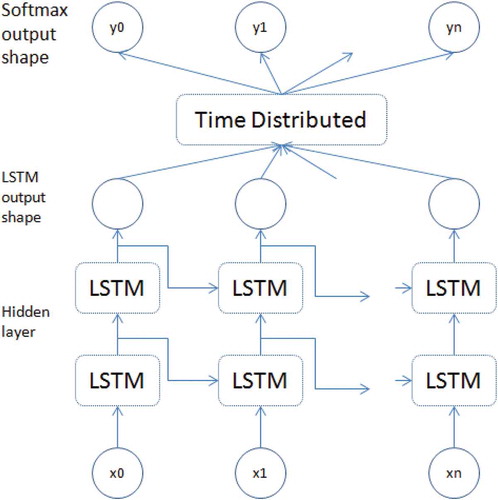
Figure 6. Floating data window
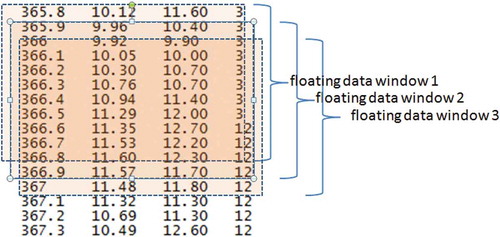
Table 1. Results of classifiers on simulated data
Table 2. Results of classifiers on real data
Table 3. Classification results for partial replacement of real data with simulated data
Table 4. Classification results on a mixed dataset
Table 5. Classification results for different sizes of a floating window
Table 6. Classification results when adding boreholes coordinates