Figures & data
Figure 1. Laboratory stand, used for TFBG temperature measurements
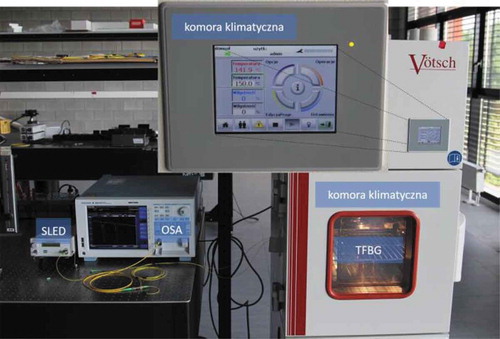
Figure 2. LP117 cladding module capacity changes for tilt angle various values of α input polarization plane in the range from 0° to 85°
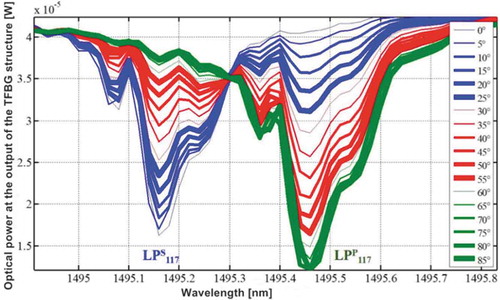
Figure 3. LP117 module capacity changes for various light input polarization tilt angle values in the range from 90° to 180°
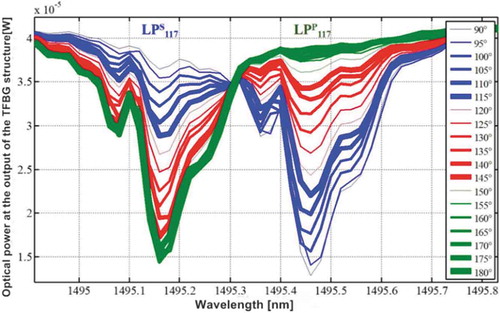
Figure 4. Numbering scheme of TFBG 7.5°, denoting the conditions S and P
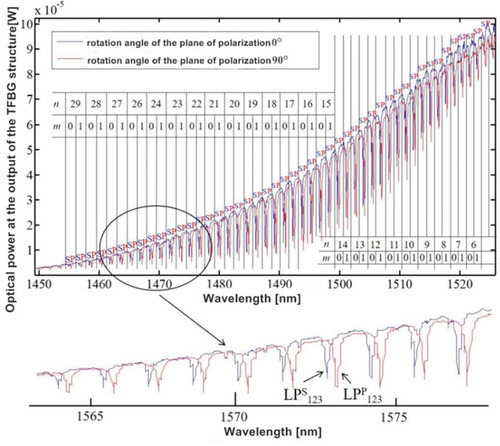
Figure 5. Changes of mode capacity in the cladding LP122 for the α light input polarization plane tilt angle vary from 0° to 180°
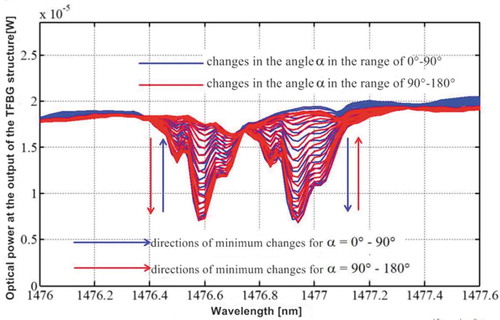
Figure 6. System for interrogating the signals from polarization sensors based on the TFBG structures
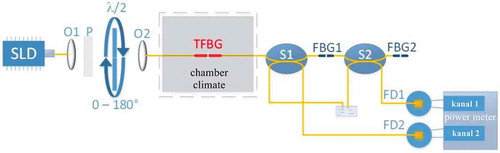
Figure 7. Mutual position of spectral characteristics of periodical structures from the system, shown on the Figure : (а) drop of polarization plane tilt angle, equals to 45°, (b) drop of polarization plane tilt angle, equals to 90°
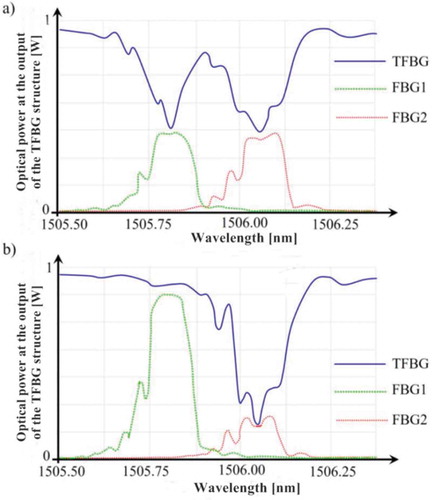
Figure 8. Capacity, measured with a photodetector FD1, divided by the capacity, measured with a photodetector FD2, dependent on α light input polarization plane rotation angle
Figure 9. Features of processing system from the Figure , both channels powers ratio in the α angle change range from 15° to 60°
Figure 10. The intensity of the signal, reflected from FBG 1 and FBG 2 filters, has been measured in the scheme, shown on the Figure 6
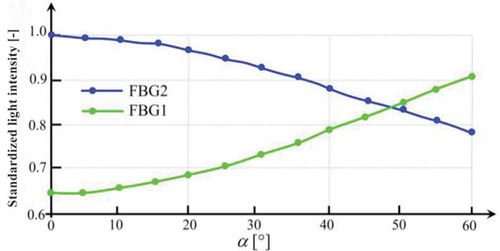
Figure 11. Power ratio at photodetectors as temperature function for two magnitudes of α light input polarization rotation angle and five power values (P1), recorded with a photodetector FD1
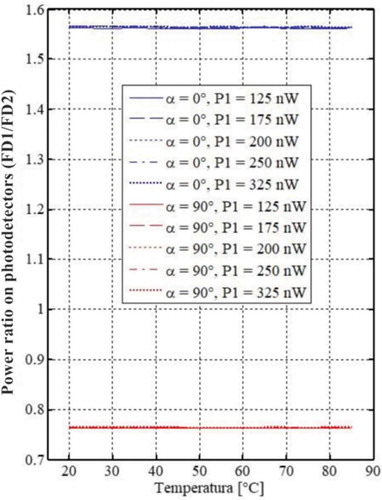
Figure 12. Power factor at photodetectors as the temperature function for the running values of the power (P1), having been recorded with a photodetector FD1. Blue lines represent the measurements, fulfilled for S-type polarization, red lines correspond to the measurements, made with P-type polarization
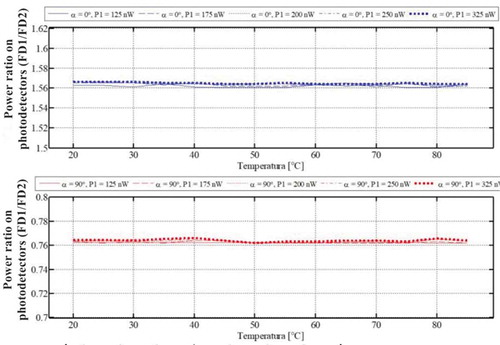
Figure 13. Power factor at photodetectors FD1/FD2 as the temperature function for several light input polarity plane rotation angle values