Figures & data
Table 1. Global horizontal irradiance (GHI) data and wind speed for Patenga, Chittagong
Figure 1. Proposed Ssystem Ggeographical Llocation at Patenga
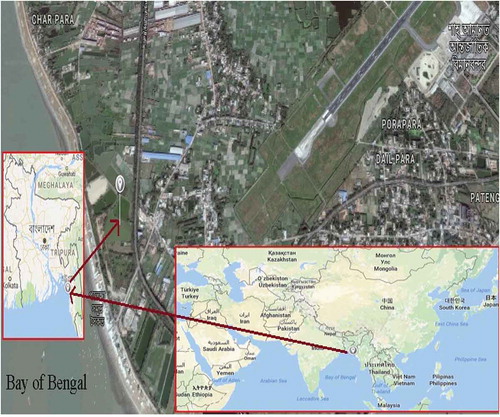
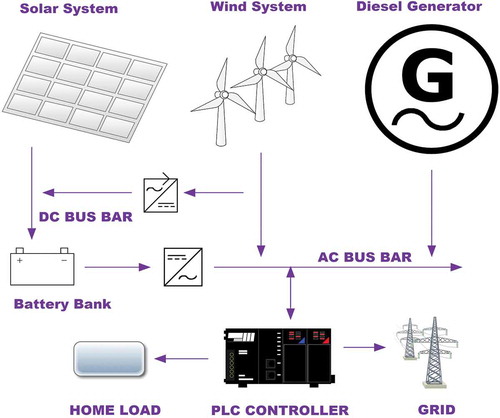
Figure 2. Hybrid Ssystem Mmodel

Table 2. Proposed system components specification
Figure 3. Monthly Aaverage Ssolar Rradiation Ddata
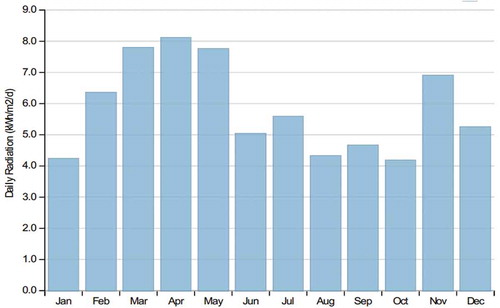
Table 3. PV system specification
Figure 4. Monthly Aaverage Wwind Sspeed Ddata
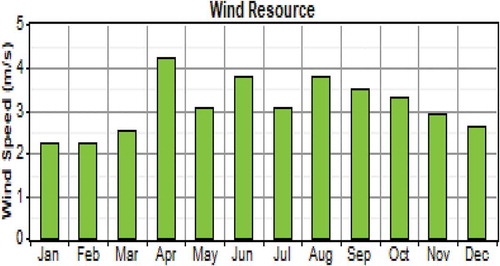
Table 4. Wind turbine generator specification
Table 5. Diesel generator specification
Table 6. Battery specification
Table 7. Monthly energy load demand
Table 8. Other components capacity and cost specification
Figure 5. PV power curve
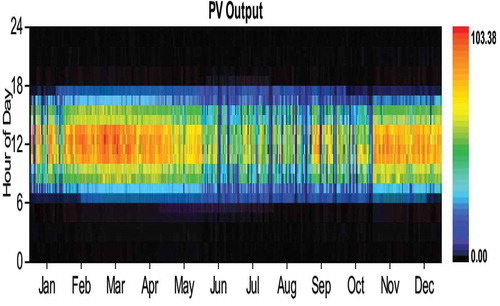
Figure 6. PV monthly power production
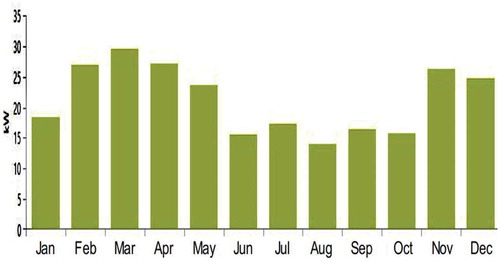
Table 9. PVsystem output power
Figure 7. Wind power output
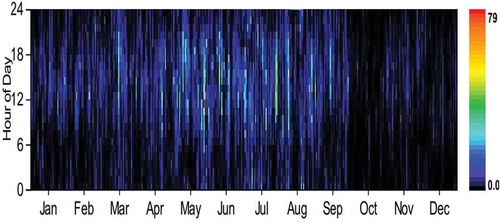
Figure 8. Wind turbine monthly production
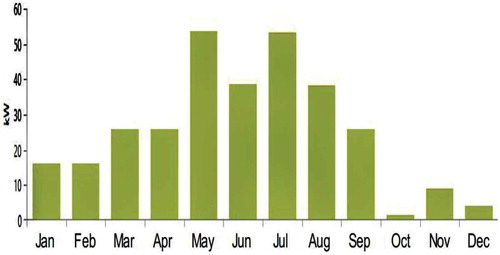
Table 10. Wind turbine generator output power
Figure 9. Diesel generator output
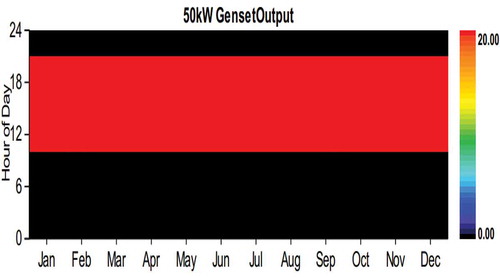
Table 11. Diesel generator output power
Figure 10. Total hybrid system electricity production
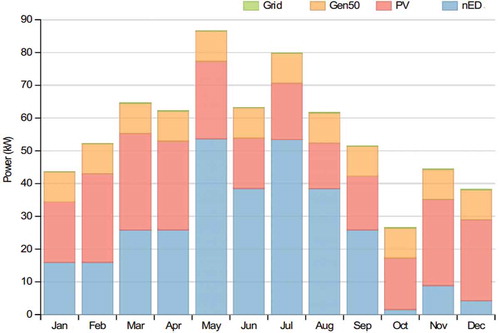
Figure 11. Energy sell into grid
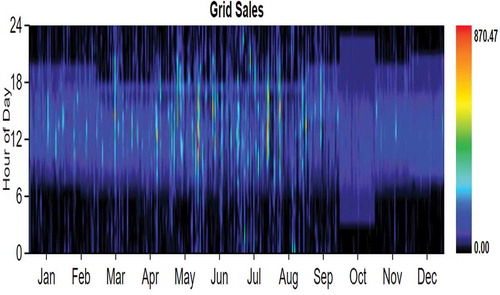
Table 12. Total hybrid electricity production and consumption
Table 13. Analysis of grid selling price
Figure 12. Proposed control system diagram
Figure 13. Total electricity production controlled by plc
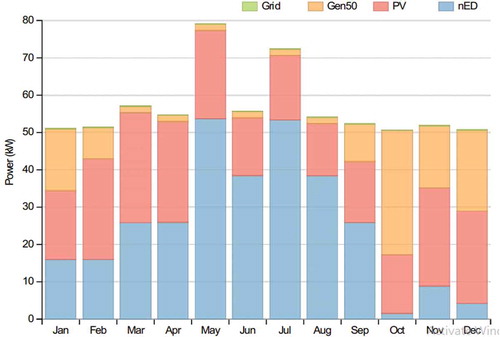
Figure 14. Generator output curve controlled by plc
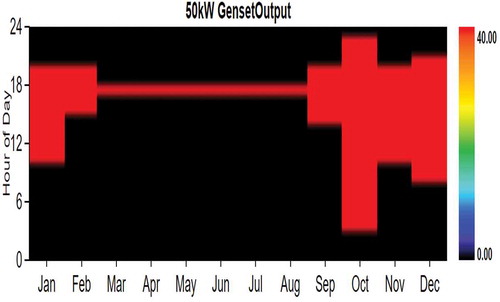
Figure 15. Components wise cost of the hybrid system
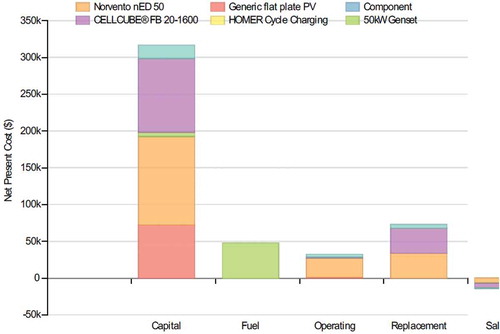
Figure 16. Hybrid system cash flows yearly
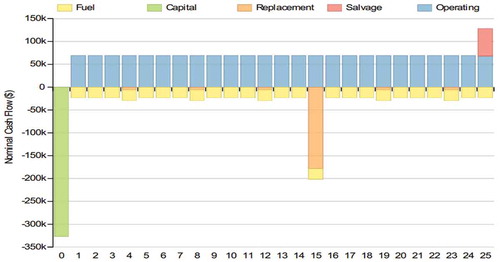
Table 14. Net present costs of the hybrid system
Table 15. Annualized costs of the hybrid system
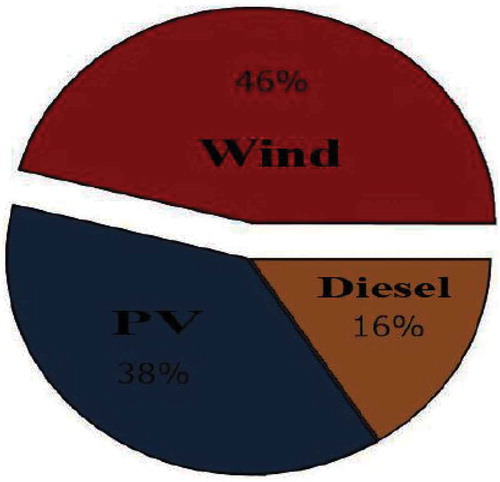
Figure 17. The system electricity contribution