Figures & data
Table 1. The comparison between the existing literature and the present research work
Table 2. List of notations
Figure 1. Possible cases of renewal cycle in the presence of supply disruption.
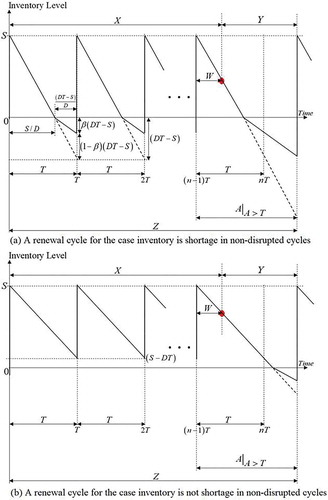
Figure 2. The last inventory cycle when .
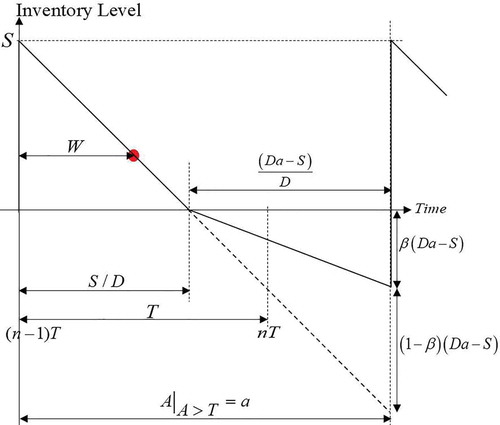
Figure 3. The possible scenarios of the last inventory cycle when .
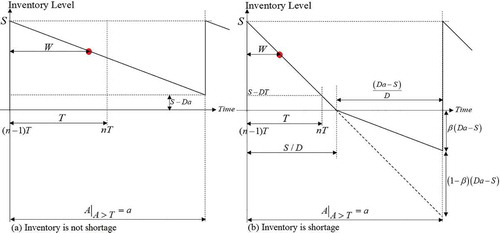
Figure 4. Flow chart of solution method.
Table A1. Optimal base stock level and minimum cost per day for = 1.00
Table A2. Optimal base stock level and minimum cost per day for = 0.50
Table A3. Optimal base stock level and minimum cost per day for = 0.10
Table A4. Optimal base stock level and minimum cost per day for = 0.00
Figure B1. Optimal base stock level and minimum cost per time unit for = 0.1.
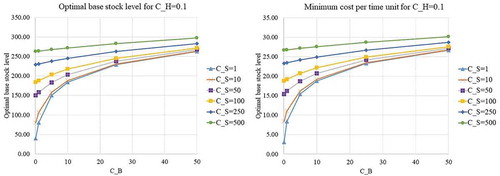
Figure B2. Optimal base stock level and minimum cost per time unit for = 1.
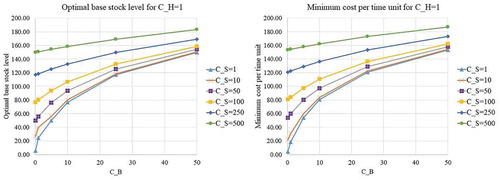
Figure B3. Optimal base stock level and minimum cost per time unit for = 5.
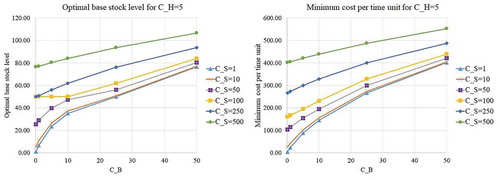
Figure B4. Optimal base stock level and minimum cost per time unit for = 10.
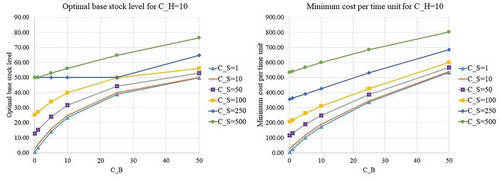
Figure B5. Optimal base stock level and minimum cost per time unit for = 25.
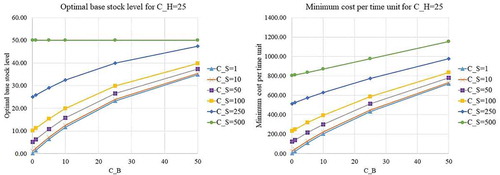
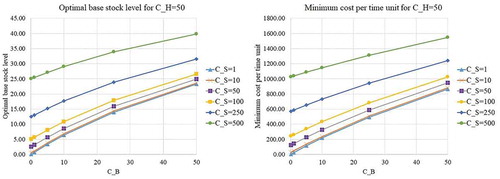
Figure B6. Optimal base stock level and minimum cost per time unit for = 50.