Figures & data
Figure 1. Flowchart of the research.
Figure 2. Q-Edu features for one of the schools in Kazakhstan.
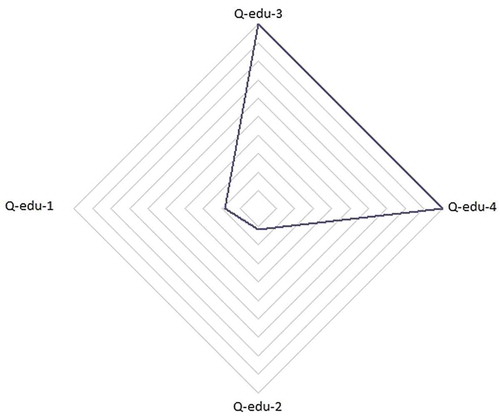
Figure 3. MCDSS&BBE workflow schema.
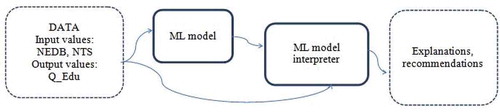
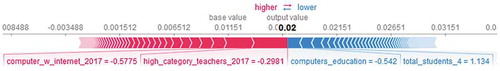
Figure 4. The influence of factors on the feature Q-Edu-3 part 1/2 (Proportion of graduates who scored a passing score on the UNT).
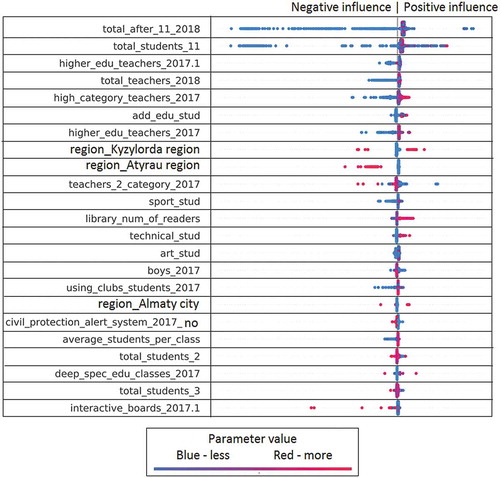
Figure 5. The influence of factors on the feature Q-Edu-3 part 2/2 (Proportion of graduates who scored a passing score on the UNT).
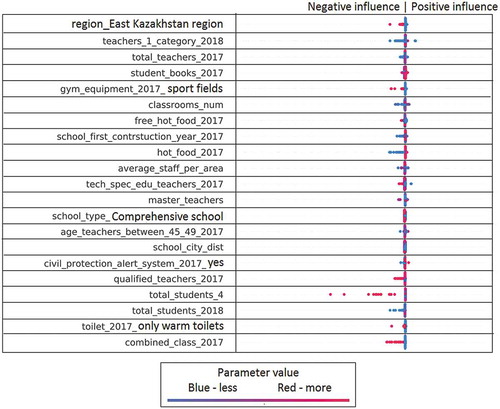
Figure 6. The influence of factors on the feature Q-Edu-4 part 1/2 (Percentage of graduates who continue their education after graduation).
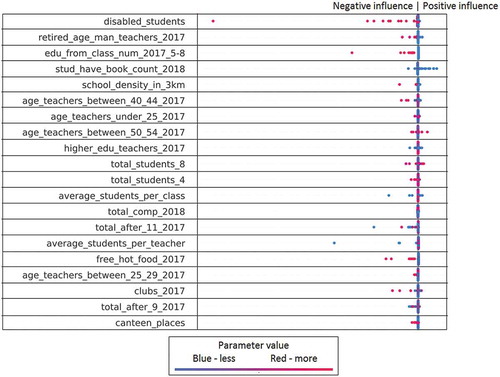
Figure 7. The influence of factors on the feature Q-Edu-4 part 2/2 (Percentage of graduates who continue their education after graduation).
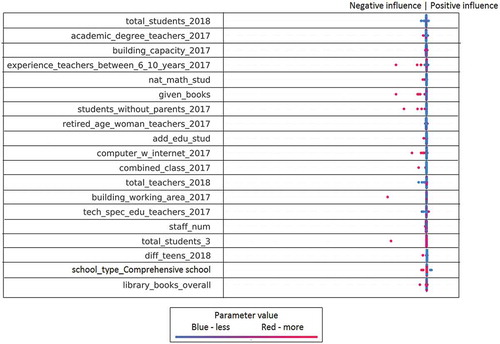
Figure 8. Influence of factors on the feature Q-Edu-1 part 1/2 (Percentage of graduates who received a scholarship for the best specialties at the best universities).
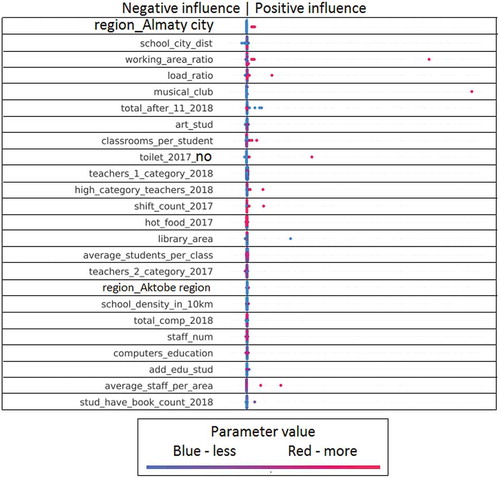
Figure 9. The influence of factors on the feature Q-Edu-1 part 2/2 (Percentage of graduates who received a scholarship for the best specialties at the best universities).
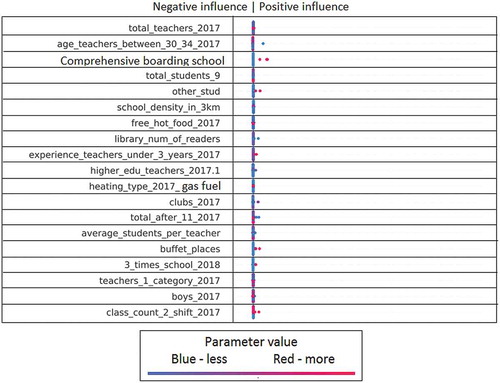
Figure 10. The influence of factors on the feature Q-Edu-2 part 1/2 (Number of elite achievements (gold medal (AltynBelgi), victories in national and international competitions)).
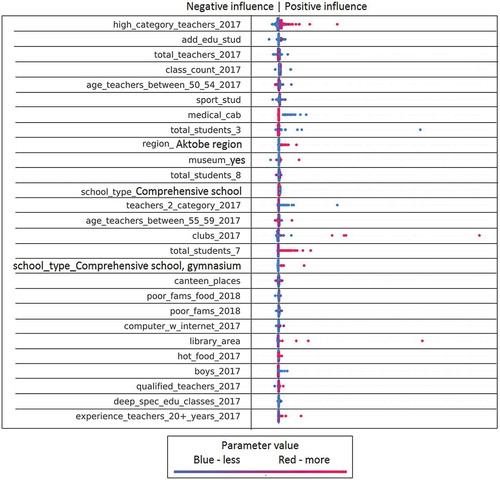
Figure 11. The influence of factors on the feature Q-Edu-2 part 2/2 (Number of elite achievements (gold medal (Altyn Belgi), victories in national and international competitions)).
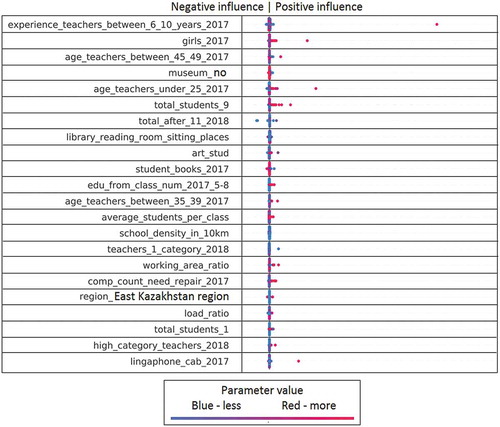
Figure 12. The effect of features on the Q-Edu-2 feature of school X.
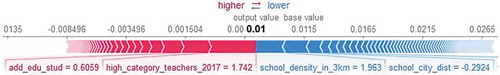
Figure 13. The effect of features on the Q-Edu-4 feature of school Y.