Figures & data
Figure 1. Hierarchy levels of human needs (Song et al., Citation2012).
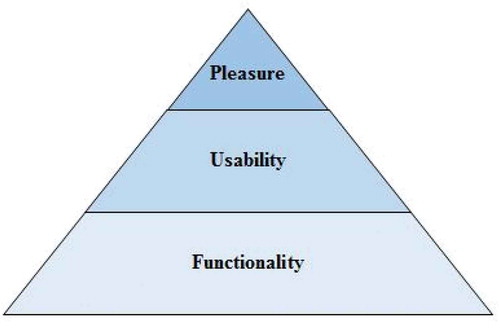
Figure 2. Snapshots of websites used for the Kansei survey.
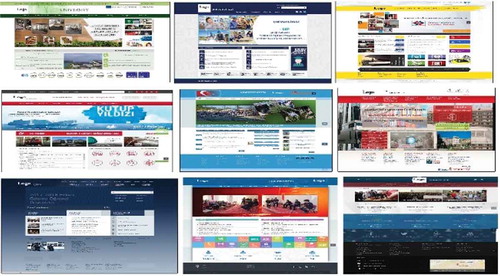
Table 1. Factor loadings after varimax rotation
Figure 3. Scores of the nine websites on factors F1 and F2. Total variance explained is 96.5%.
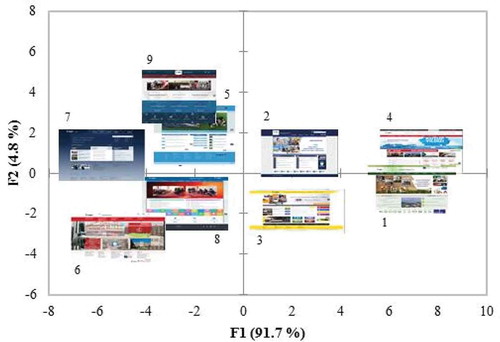
Table 2. Classification of items/categories
Table 3. Sample of the categories identified from websites
Table 4. The PLS regression results for three categories
Table 5. Chosen positive effect for 14 categories based on the PLS regression results
Figure 4. Proposed universal design of an attractive university website.