2,930
Views
12
CrossRef citations to date
0
Altmetric
MATERIALS ENGINEERING

Development of functionalized CuO nanoparticles for enhancing the adsorption of methylene blue dye

, & | (Reviewing editor)
Article: 1783102 | Received 03 Apr 2020, Accepted 11 Jun 2020, Published online: 30 Jun 2020

Figures & data

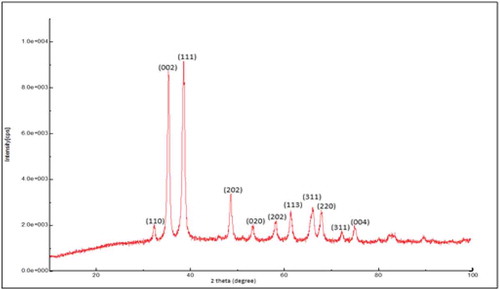
Figure 1. XRD spectrum of pure CuO nanoparticles.

Figure 1. XRD spectrum of pure CuO nanoparticles.

Figure 2. (a) SEM images of bare CuO nanoparticles with different magnification. (b) SEM images of EDTA functionalized CuO nanoparticles. (c) SEM images of EDTA-silane functionalized CuO nanoparticles.
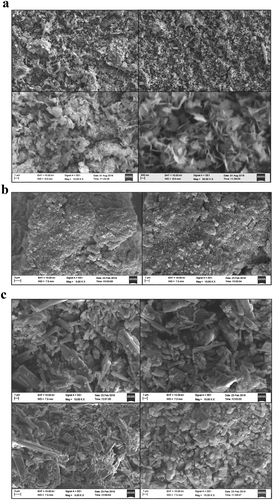
Figure 2. (a) SEM images of bare CuO nanoparticles with different magnification. (b) SEM images of EDTA functionalized CuO nanoparticles. (c) SEM images of EDTA-silane functionalized CuO nanoparticles.

Figure 3. FTIR spectra showing the comparison between the peaks of pure and functionalized CuO nanoparticles.
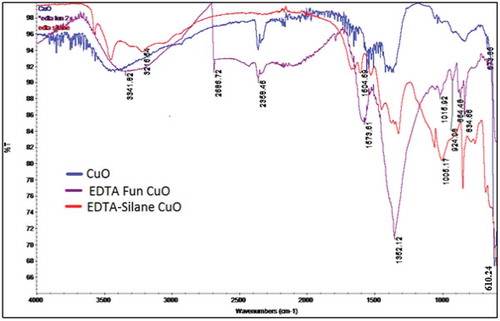
Figure 3. FTIR spectra showing the comparison between the peaks of pure and functionalized CuO nanoparticles.

Figure 4. (a) XPS spectra of EDTA functionalized CuO nanoparticles showing the presence of C by ejection of electron from C-1 s orbital. (b) XPS spectra of EDTA functionalized CuO nanoparticles showing the presence of Cu by the ejection of electron from the Cu-2p orbital. (c) XPS spectra of EDTA functionalized CuO nanoparticles showing the presence of Cu by the ejection of electron from the O-1 s orbital.
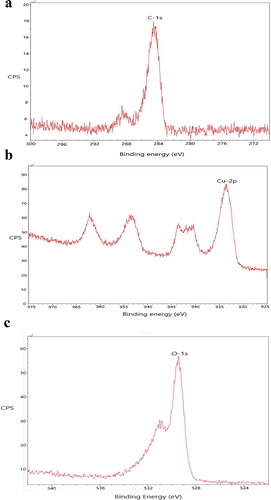
Figure 4. (a) XPS spectra of EDTA functionalized CuO nanoparticles showing the presence of C by ejection of electron from C-1 s orbital. (b) XPS spectra of EDTA functionalized CuO nanoparticles showing the presence of Cu by the ejection of electron from the Cu-2p orbital. (c) XPS spectra of EDTA functionalized CuO nanoparticles showing the presence of Cu by the ejection of electron from the O-1 s orbital.

Figure 5. (a) BET adsorption isotherm showing the relation between volume and relative pressure giving surface area of the material. (b) BET adsorption isotherm showing the relation between differential pore volume and pore width giving pore diameter of the nanoparticle.
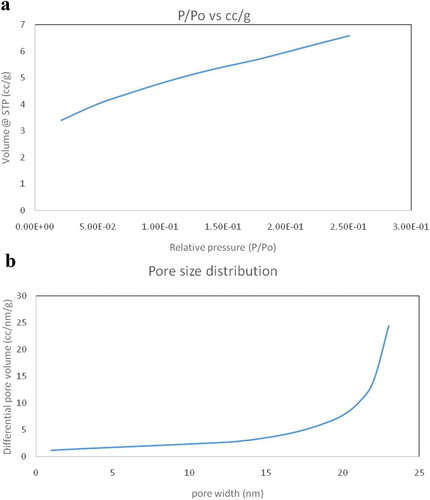
Figure 5. (a) BET adsorption isotherm showing the relation between volume and relative pressure giving surface area of the material. (b) BET adsorption isotherm showing the relation between differential pore volume and pore width giving pore diameter of the nanoparticle.

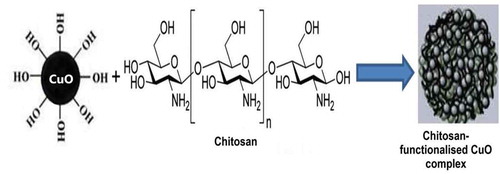
Figure 6. Formation of chitosan-functionalised CuO complex.

Figure 6. Formation of chitosan-functionalised CuO complex.

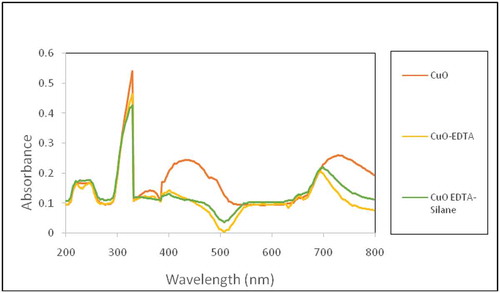
Figure 7. UV-Visible spectra of adsorption study.

Figure 7. UV-Visible spectra of adsorption study.

Table 1. Percentage adsorption by nanoparticles