Figures & data
Figure 1. Airflow and energy fluxes around the upper channel (a), lower channel (b) of a DPSC.
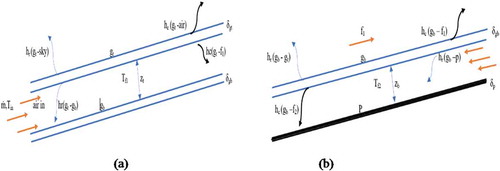
Figure 2. The developed DPSC banana solar dryer.
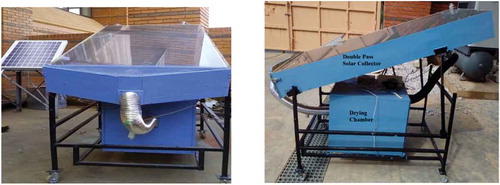
Figure 3. An outlay of developed banana solar dryer: 1. Top glass, 2. Bottom glass, 3. Absorber plate, 4. Air gap, 5. Insulators, 6. Fan, 7. Tray, 8. Aluminum pipe, 9. Outlet, 10.
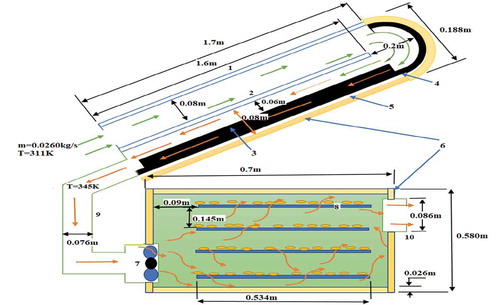
Figure 4. Sliced banana fruits on a tray and loaded into the drying chamber.
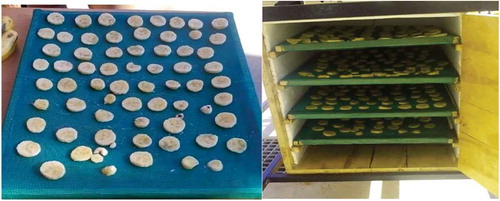
Figure 5. A 3D computational domain of a DPSC (a), a 3D mesh of a DPSC (b).
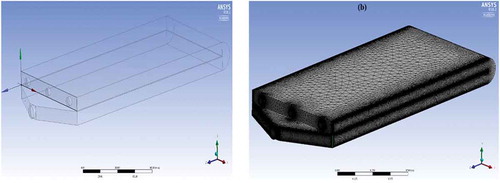
Figure 6. The geometry (a) and grid mesh (b) of the drying chamber flow domain and the trays.
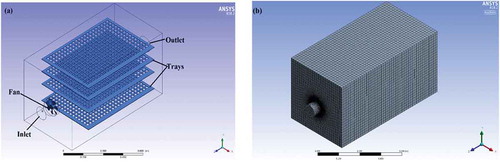
Table 1. Properties and mesh metric parameters of a DPSC and drying chamber
Figure 7. Extracted geometry of the volume of double-pass solar collector.
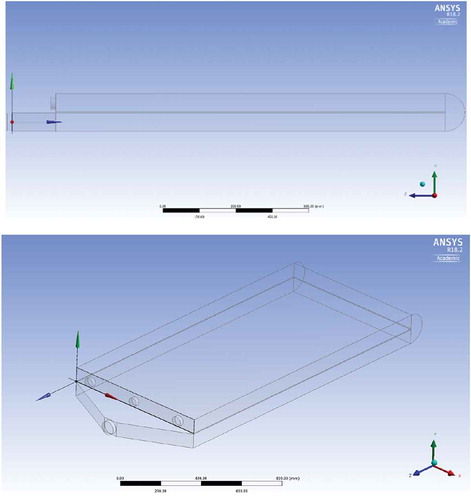
Figure 8. Different meshing techniques of the double-pass solar collector (a) Body meshing (b) Fine mesh on corners, curves, rounds and edges of the solar collectors.
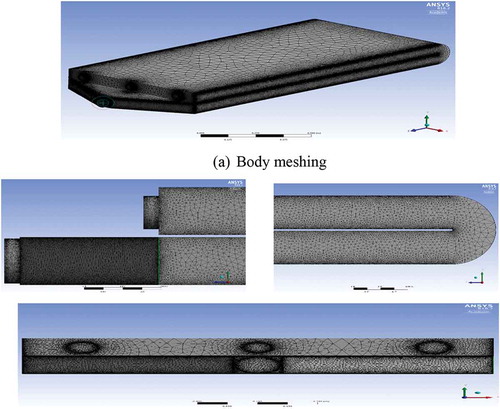
Figure 9. A 3D element quality (a) and skewness (b) of the double-pass solar collector.
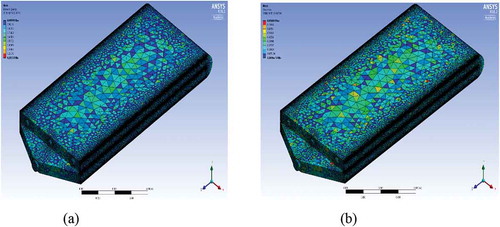
Table 2. Some input parameters for the solar collector simulation
Table 3. Convergence criteria of the collector CFD simulation
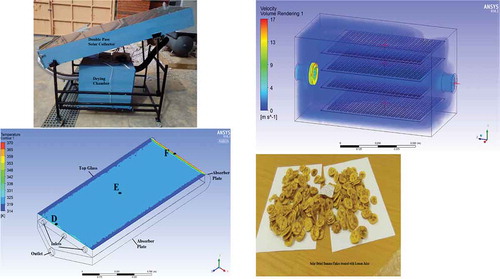
Figure 10. (a). Inlet & outlet temperatures. (b). Temperature distribution within the DPSC.
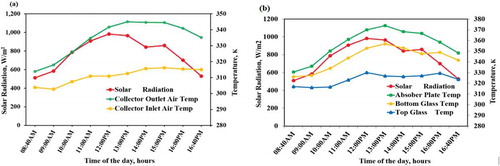
Figure 11. (a) Effect of mass flow rate on collector efficiency. (b) Percentage of useful heat gained.
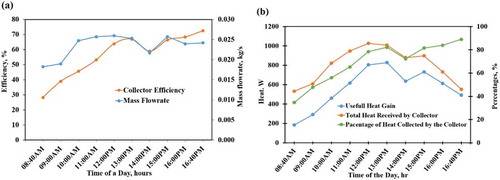
Figure 12. (a). Temperature pattern on the absorber plate surface. (b). Temperature pattern on the top glass.
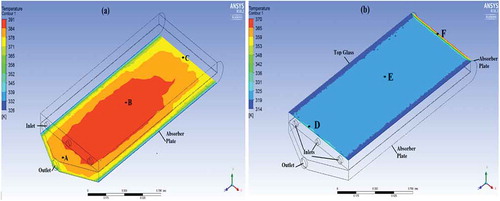
Table 4. Comparative temperature distributions on absorber plate and top glass from the CFD modeling and experiment results
Figure 13. Comparison of experimental and simulation values of Nusselt numbers under different Reynolds values.
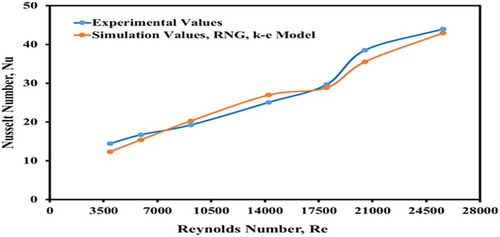
Figure 14. Dried banana chips showing no de-coloration.
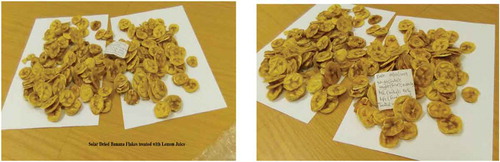
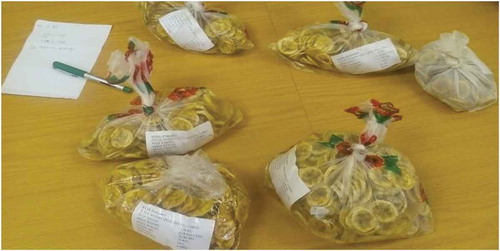
Figure 15. Sealed dried banana flakes (over a three-month duration).
Table