Figures & data
Table 1. Methods applied during experiments
Figure 1. Road traffic accident experimental framework
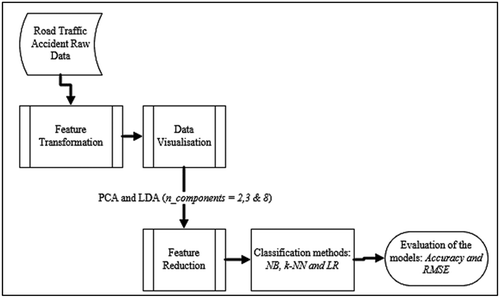
Table 2. Features used for investigation
Table 3. Dataset class value distribution
Figure 2. Summary of RTAs yearly
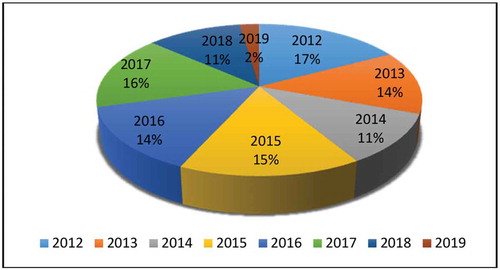
Figure 3. Data distribution (a) Gender, (b) Month, (c) Location and (d) Season
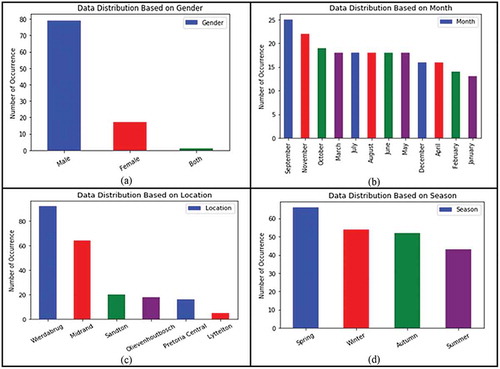
Figure 4. Histogram (a) DayOfWeek and (b) Event
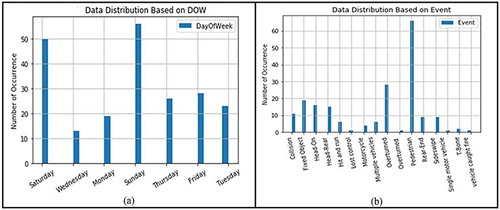
Figure 5. Boxplot (a) TotalNoVictims vs Event, (b) InvolvedVehicles vs Event
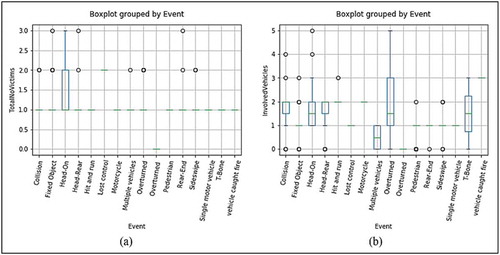
Table 4. Number of PCs by feature importance
Figure 6. MEAN IM Data distribution PC1 and PC2 grouped by classes
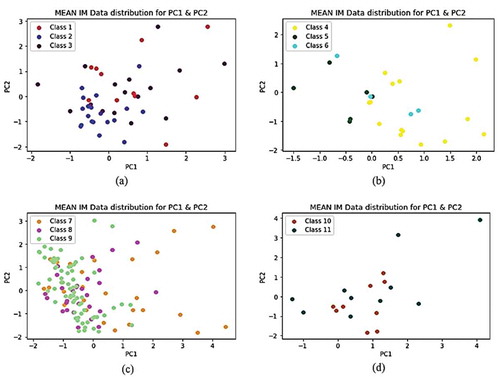
Figure 7. K-NN IM Data distribution PC1 and PC2 grouped by classes
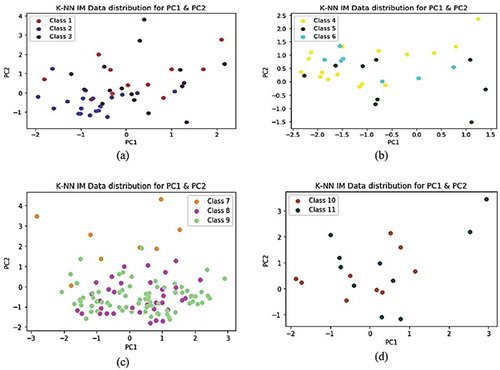
Figure 8. MEAN IM Data distribution LD1 and LD2 grouped by classes
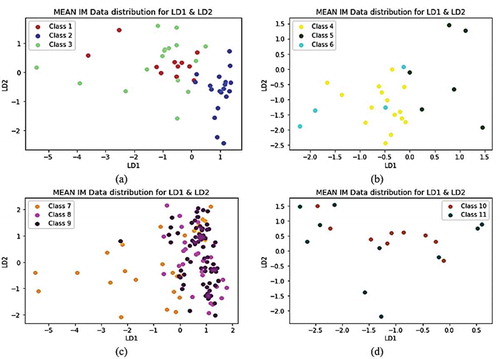
Figure 9. K-NN IM data distribution LD1 and LD2 grouped by classes
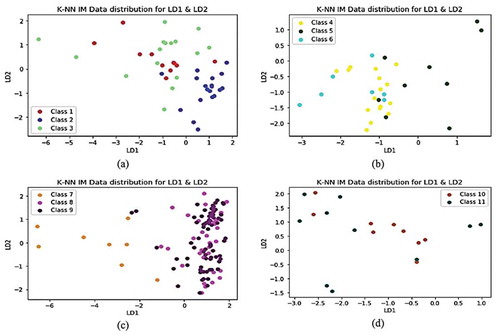
Table 5. Summary of the model results
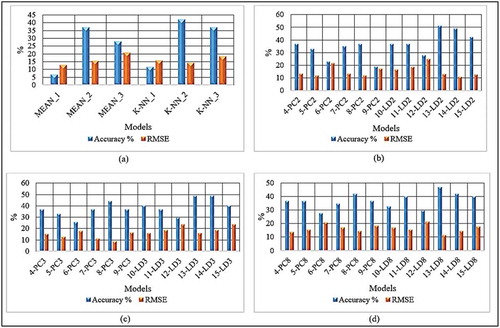
Figure 10. RTA Classification Models (a) Default settings (b)PCA and LDA components 2, (c) PCA and LDA components 3 and (d)PCA and LDA components 8