
Figures & data
Figure 1. The block diagram of the proposed diseases classification approach
Figure 2. A visual illustration of the approach used for determining the period (T)
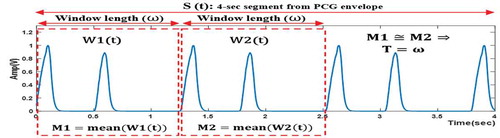
Figure 3. The flow chart of the proposed automatic segmentations algorithm
Figure 4. Illustrating the importance of satisfying the two main criteria for extracting the 4-sec segment from the SEE. These two criteria are not considered in (a)–(c) but considered in (d)–(f). (a), (d) Shannon Energy Envelope (SEE) of PCG signal; (b), (e) 4-sec segment from the SEE; (c), (f) determining the period (T)
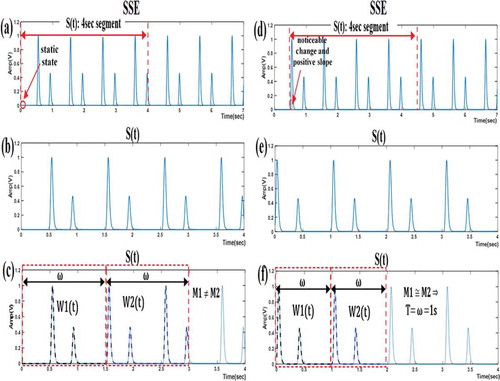
Figure 5. Illustrating the importance of satisfying the two main criteria for defining the second window (W2(t)) within S(t). (a) determining the period (T), where the two main criteria are ignored; (b) determining the period (T), where the two main criteria are considered
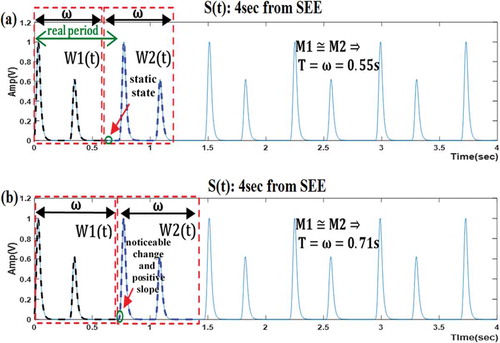
Figure 6. Segmentation algorithm results for PCG signals for (1) normal case and (2) abnormal case: (a1), (a2) preprocessed PCG signal; (b1), (b2) the murmur-attenuated signal; (c1), (c2) Shannon Energy Envelope (SSE); (d1), (d2) 4 sec segment from the SSE; (e1), (e2) determining the period (T); (f1), (f2) a single-segmented cardiac cycle
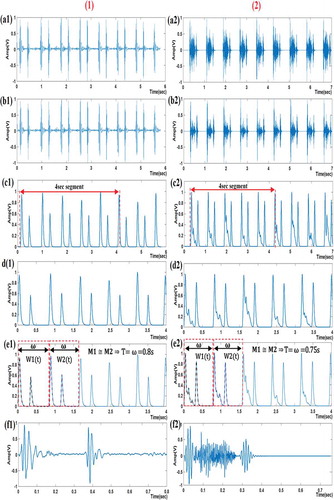
Figure 7. OBW illustrated on PSD curve of the single cycle of normal PCG signal
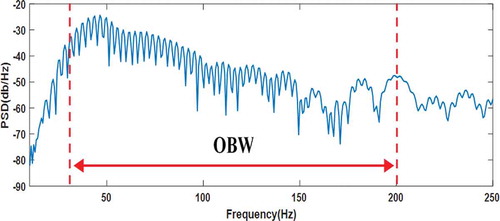
Figure 8. Wavelet approximation coefficient (A5) and Wavelet detail coefficients (D5, D4, D3) resulting from decomposing the single cycle of normal PCG signal with ‘db6ʹ wavelet
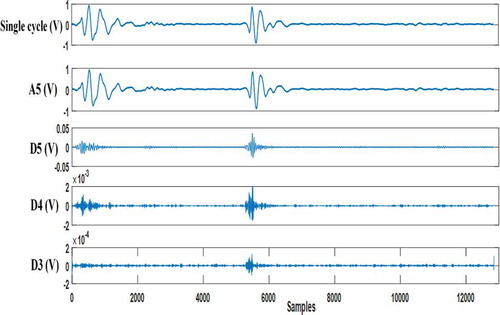
Figure 9. The feedforward backpropagation ANN used in classification
Table 1. The performance of several feedforward backpropagation ANN models
Table 2. Performance comparison between the adopted backpropagation
Figure 10. The diagnostic hardware system
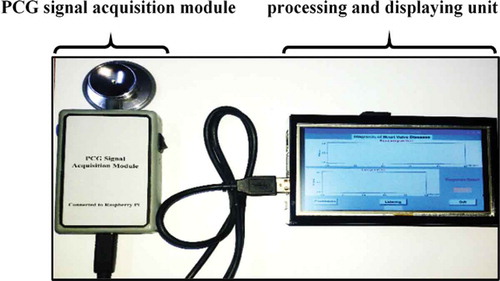
Figure 11. [Courtesy of Medical Electronics Lab], A demo of a clinical test process using the diagnostic hardware system
![Figure 11. [Courtesy of Medical Electronics Lab], A demo of a clinical test process using the diagnostic hardware system](/cms/asset/8ebfc895-361a-43b1-b95a-c8d0831e3d15/oaen_a_1856757_f0011_oc.jpg)
Figure 12. The block diagram of PCG signal acquisition module
Figure 13. Connecting the microphone to the chest piece
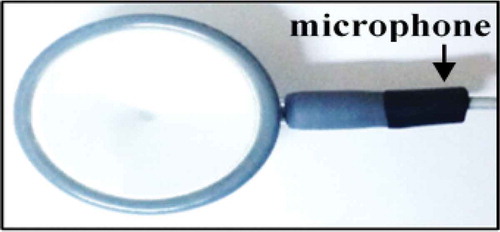
Figure 14. Processing and displaying unit
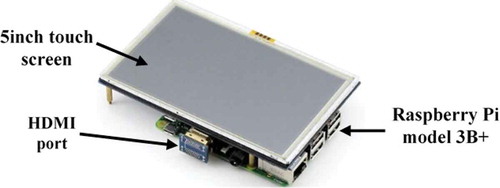
Figure 15. The system’s GUI designed in the software of Raspberry Pi
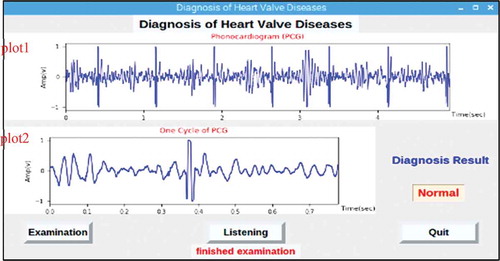
Table 3. Obtained performance metrics of the diagnostic hardware system
Table 4. Comparison between the proposed system and previous systems