Figures & data
Figure 1. Coupon dimensions for tensile testing
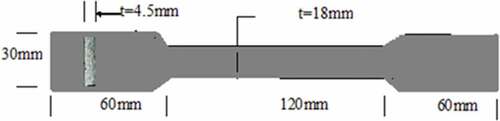
Figure 2. uPVC coupon test: (a) during loading; (b) after testing
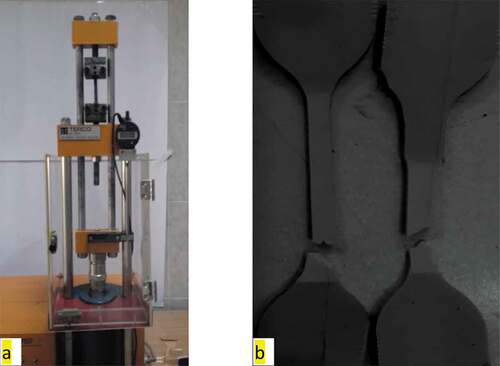
Figure 3. Failure of the hollow tube due to local buckling
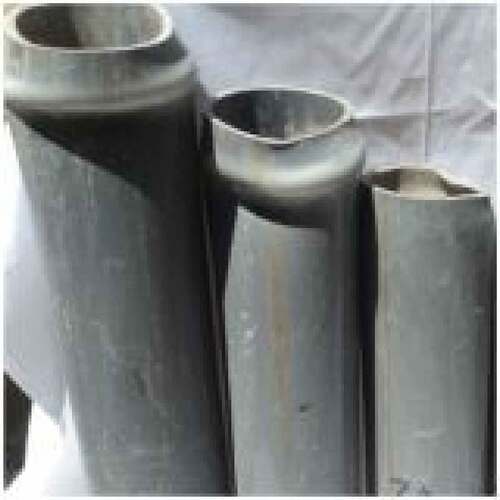
Figure 4. uPVC tube confined columns with 5 mm thickness before the test
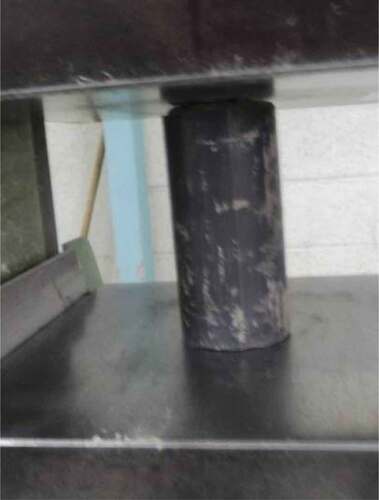
Figure 5. uPVC tube confined columns with 5 mm thickness after the test
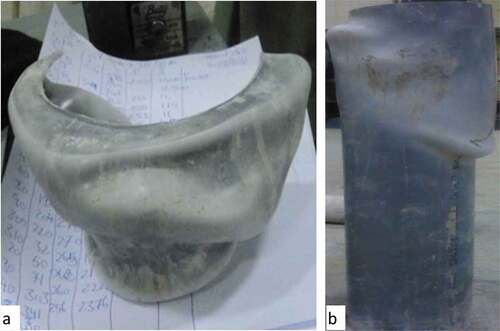
Figure 6. uPVC tube confined columns with 7 mm thickness: (a) before the test; (b) and (c) after the test
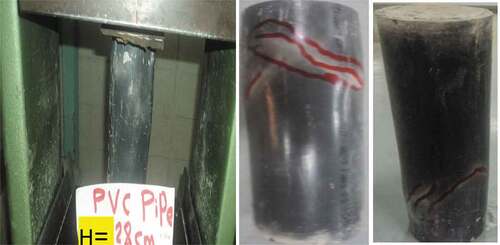
Figure 7. Stress-strain relationship of uPVC-confined concrete under axial load
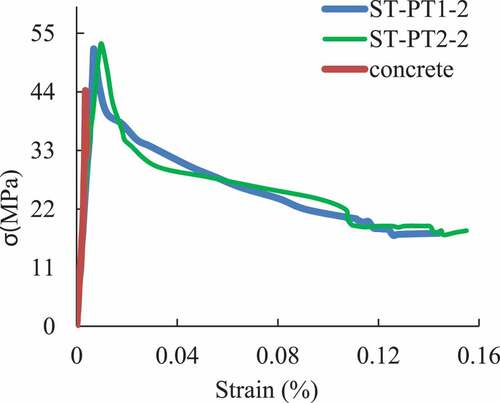
Table 1. Ultimate stress and strain of uPVC-confined concrete
Table 2. Experimental database of uPVC-confined concrete under direct load
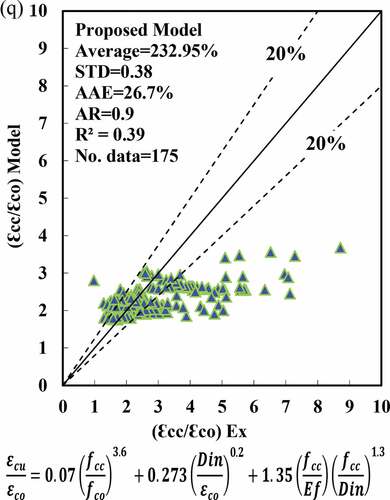
Figure 8. Predicted strain ratio εcu/εco using FRP equations versus experimental εcu/εco
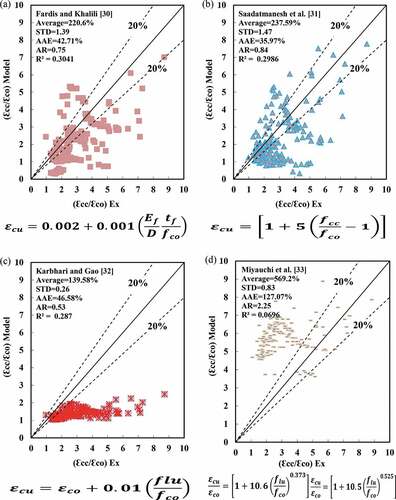
Figure 8. (Continued)
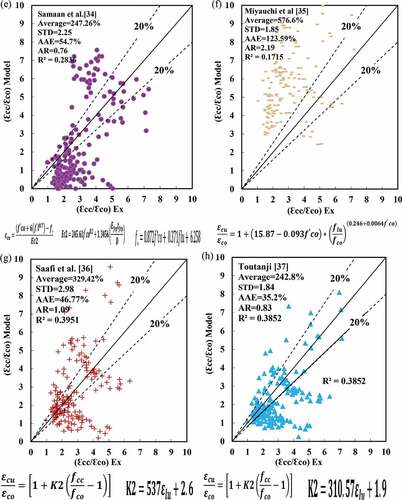
Figure 8. (Continued)
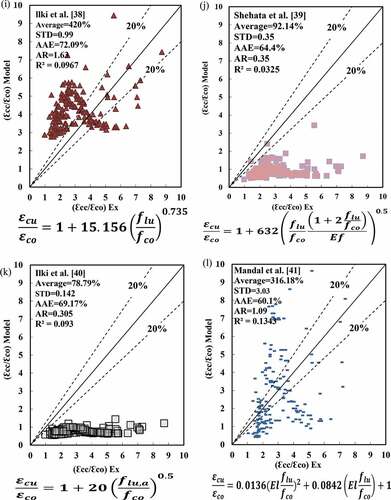
Figure 8. (Continued)
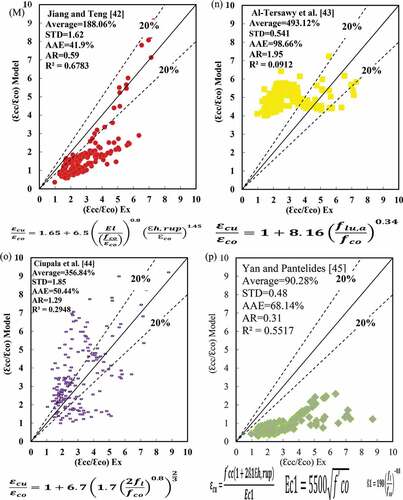
Figure 8. (Continued)
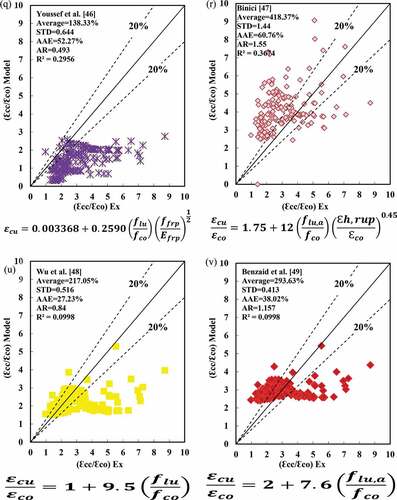
Figure 9. Predicted εcu/εco using the proposed model versus experimental εcu/εco 566 values