
Figures & data
Figure 1. Typical mid-rise residential building with open ground floor

Figure 2. Flowchart of the adopted progressive collapse analysis procedure
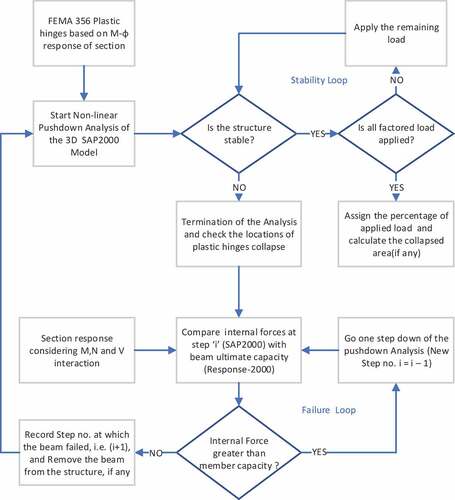
Figure 3. (a) Various SAP2000 models compared to experimental study of Yi et al. (Citation2008), (b) M-N-V interaction diagram for beam cross-section.
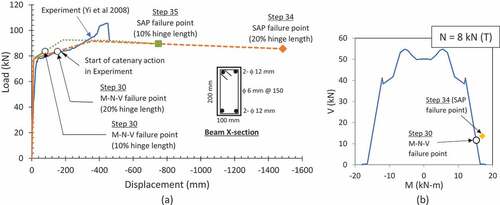
Figure 4. Typical structural framing layout plan and column removal scenarios
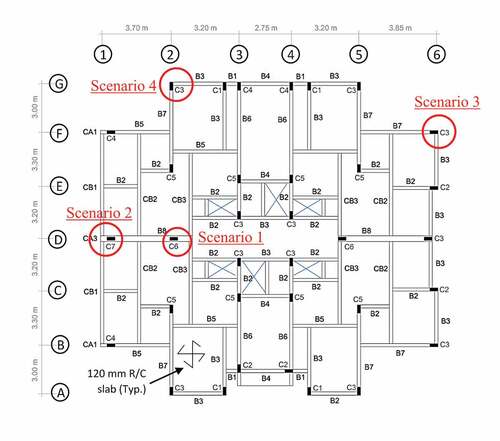
Figure 5. Partial 3D view of the structure for column removal scenarios
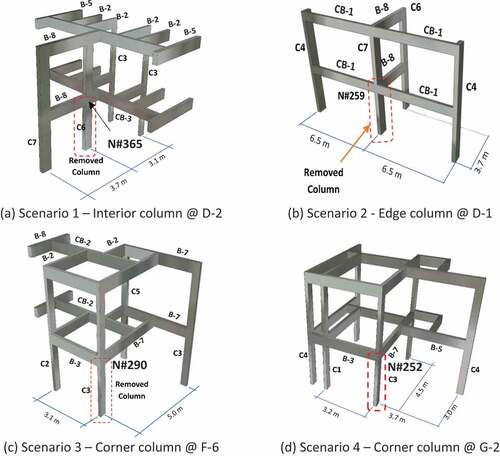
Figure 6. Bending moment and axial force distribution in the frames for Scenarios 1 & 2
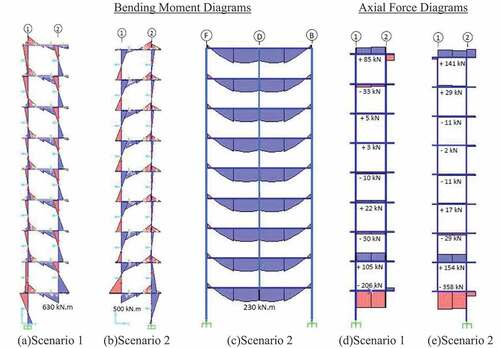
Figure 7. Bending moment and axial force distribution in the frames for Scenario 4—Loading Stage 1
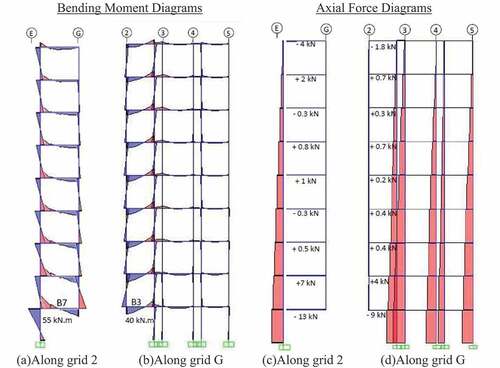
Figure 8. Effect of Axial Force on M-ϕ relationship for beam B-8 in Scenarios 1 and 2
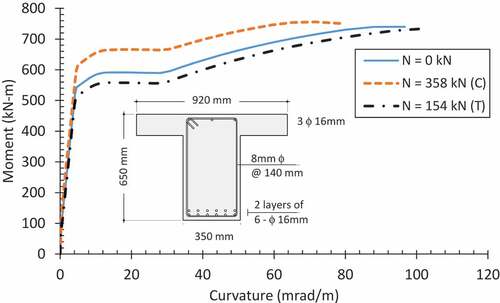
Figure 9. M-V envelope of beam B-8 and actual failure load step
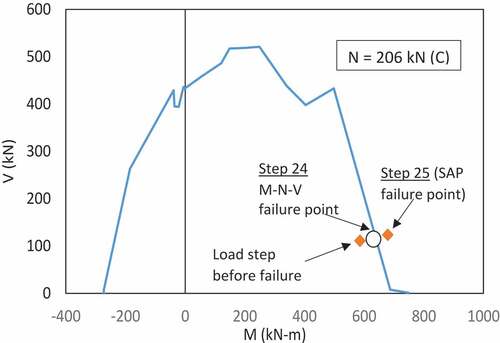
Figure 10. Formation of plastic hinges in the 2nd Stage of the 1st Scenario analysis
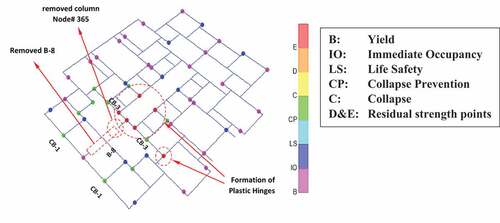
Figure 11. Total applied Load vs Vertical Deflection for Scenario 1
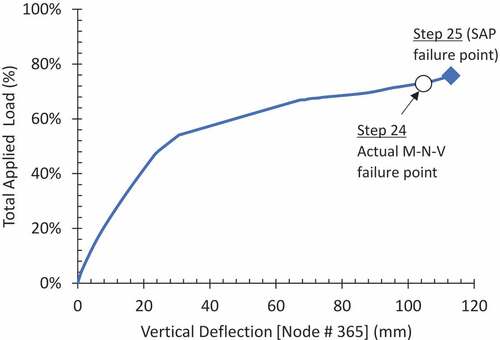
Figure 12. M-V interaction diagram for scenario 2 and tracing of beam B-8 failure at various floors
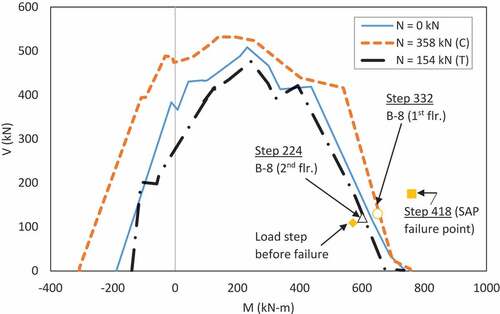
Figure 13. Deflection of node # 259 and failure sequence of various beams - Scenario 2
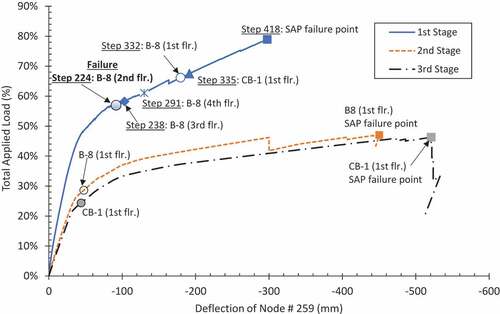
Figure 14. Deflection of node # 290 and beam failure in stages 1 and 2—Scenario 3
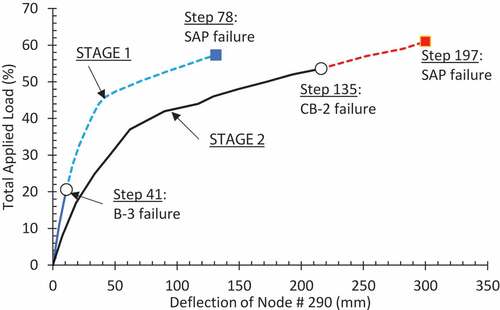
Figure 15. M-V interaction diagrams and tracing of failure point in beams B-3 and CB-2 for scenario 3
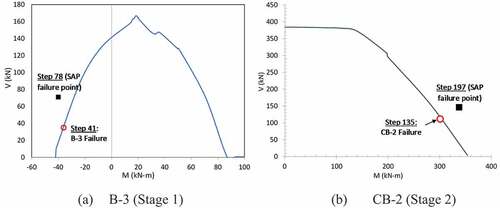
Figure 16. Deflection of node 252 and beam failure in various stages of loading—Scenario 4
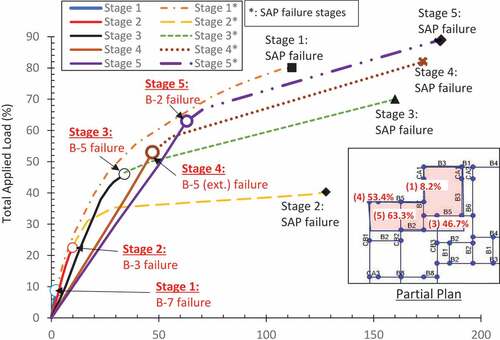
Figure 17. M-V interaction diagrams and failure points in beams B-7 and B-3 for scenario 4
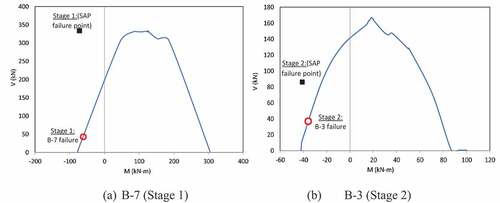
Figure 18. Partial plans showing collapsed areas for various column removal scenarios
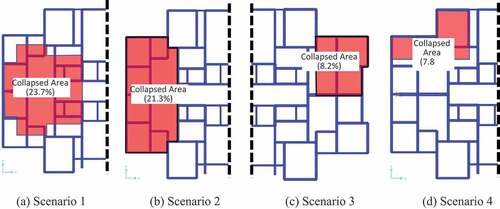
Figure 19. Plan view of moment frames for lateral wind load
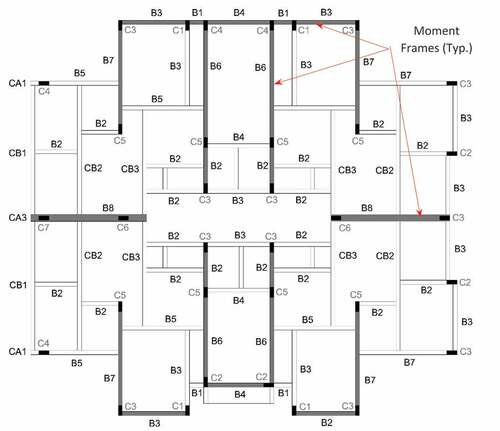
Table 1. Reinforcement details before and after providing rigid frames
Figure 20. Comparison of FEMA plastic hinge properties of original and redesigned beams B-8
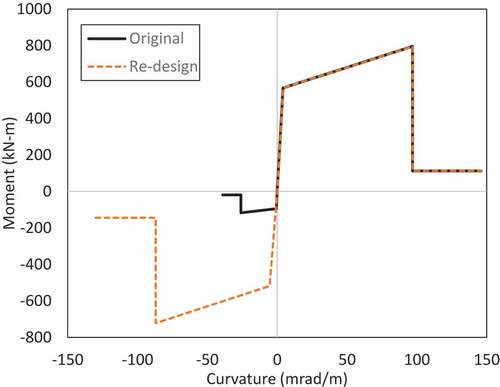
Table 2. Progressive collapse performance of original and re-designed structure
Table 3. Effect of M-N-V interaction in plastic hinges on collapse load
Table A1. Column sizes (in cm) and reinforcement details
Table A2. Dimensions and reinforcement details in simply supported beams
Table A3. Dimensions and reinforcement details in continuous beams