
Figures & data
Figure 1. Flow chart of research methodology
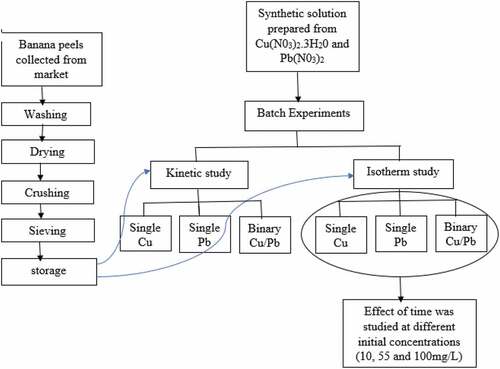
Figure 2. Point of zero charge (pHpzc) of banana peels
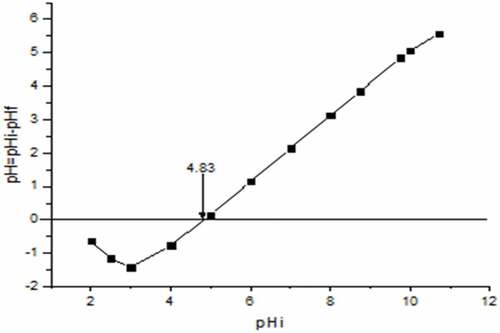
Figure 3. FTIR spectra for BP, BP-Cu, BP-Pb and BP-Cu/Pb samples
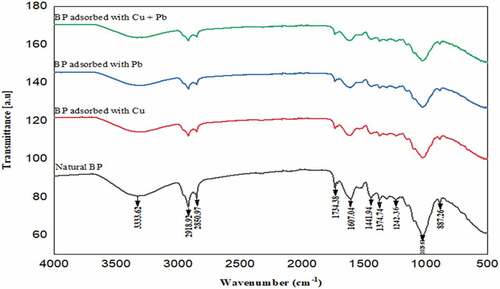
Figure 4. Adsorption isotherms of Cu and Pb on banana peel in single and binary systems at pH 5.5. The symbols are the experimental results while the solid lines are the linear fittings of (a) Cu Langmuir adsorption, (b) Pb Langmuir adsorption, (c) Cu Freundlich adsorption and (d) Pb Freundlich adsorption models
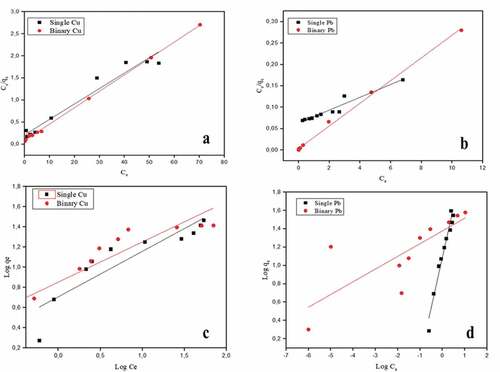
Table 1. Langmuir and Freundlich isotherm parameters
Figure 5. Percentage removal of (a) Pb(II) and (b) Cu(II) onto banana peels at different initial concentrations and pH 5.5 in both single and binary systems
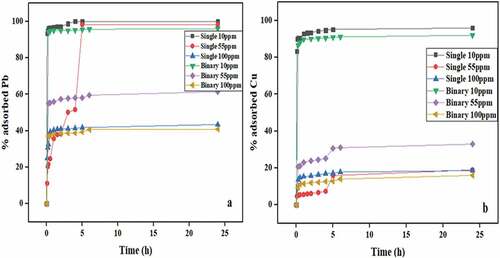
Figure 6. Kinetic model plots of Pb(II) and Cu(II) at different initial concentrations; (a) pseudo-first order single, (b) pseudo-first order binary, (c) pseudo-second order single, (d) pseudo-second order binary
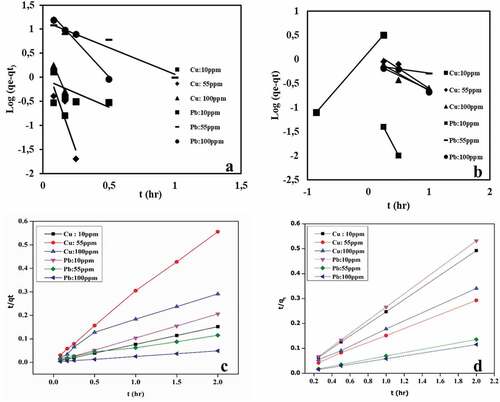
Table 2. Kinetic model parameters obtained from pseudo-first order model and pseudo-second order model
Table 3. Comparison of single solute adsorption capacity (qmax) of Pb2+ and Cu2+ with other bio-sorbents